Back to article listing

Back to article listing |
|
Shortcut to the SSP models |
| Buzzoni, A., Arnaboldi, M., Corradi, R.L.M.: | |||
| "Planetary nebulae as tracers of galaxy stellar populations", 2006, MNRAS, 368, 877. | |||
|
|
Summary:
We address the general problem of the luminosity-specific planetary
nebula (PN) number, better known as the "α" ratio, given by
α = NPN/Lgal, and its relationship with age and
metallicity of the parent stellar population. Our analysis relies on
population synthesis models, that account for simple stellar
populations (SSPs), and more elaborated galaxy models covering the
full star-formation range of the different Hubble morphological types.
This theoretical framework is compared with the updated census of the
PN population in Local Group galaxies and external ellipticals in the
Leo group, and the Virgo and Fornax clusters.
The main conclusions of our study can be summarized as follows:
i) according to the Post-AGB stellar core mass, PN lifetime in a SSP is constrained by three relevant regimes, driven by the nuclear (Mcore &ge 0.57 Msun), dynamical (0.57 Msun ≥ Mcore ≥ 0.55 Msun) and transition (0.55 Msun &ge Mcore ≥ 0.52 Msun) timescales. The lower limit for Mcore also sets the minimum mass for stars to reach the AGB thermal-pulsing phase and experience the PN event; ii) mass loss is the crucial mechanism to constrain the value of α, through the definition of the initial-to-final mass relation (IFMR). The Reimers mass-loss parameterization, calibrated on Pop II stars of Galactic globular clusters, poorly reproduces the observed value of α in late-type galaxies, while a better fit is obtained using the empirical IFMR derived from white-dwarf observations in the Galaxy open clusters; iii) the inferred PN lifetime for Local Group spirals and irregulars exceeds 10000 yr, which suggests that Mcore ≤ 0.65 Msun cores dominate, throughout; iv) the relative PN deficiency in elliptical galaxies, and the observed trend of α with galaxy optical colors support the presence of a prevailing fraction of low-mass cores (Mcore ≥ 0.55 Msun) in the PN distribution, and a reduced visibility timescale for the nebulae as a consequence of the increased AGB transition time. The stellar component with Mcore ≤ 0.52 Msun, which overrides the PN phase, could provide an enhanced contribution to hotter HB and Post-HB evolution, as directly observed in M 32 and the bulge of M 31. This implies that the most UV-enhanced ellipticals should also display the lowest values of α, as confirmed by the Virgo cluster early-type galaxy population; v) any blue-straggler population, invoked as progenitor of the Mcore ≥ 0.7 Msun PNe in order to preserve the constancy of the bright luminosity-function cut-off magnitude in ellipticals, must be confined to a small fraction (few percents at most) of the whole galaxy PN population. |
| Pick up the paper at Astro-ph/0602458 | Local gzipped Postscript version (256Kb) | ||
| HTML version at the MNRAS site (*) | PDF file at the MNRAS site (*) | ||
| (*)Requires access password |
| ||
| ||
| ||
| ||
| ||
|
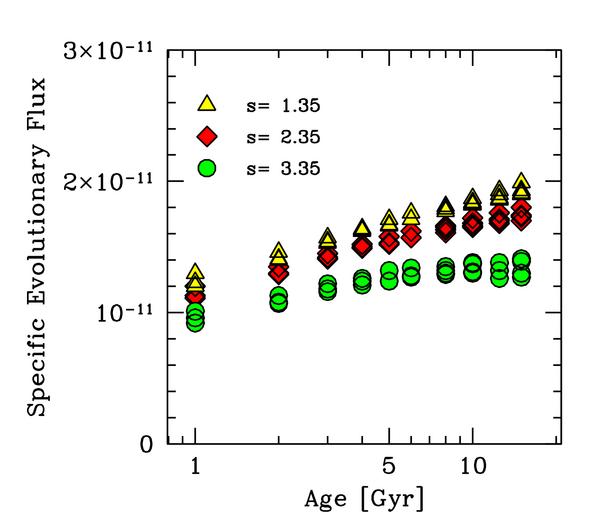 |
Figure 1 -
Specific evolutionary flux B, from eq. (4),
for Buzzoni (1989) SSP models.
Different metallicity sets (between
Z~1/20 and 2 Zsun) are overplotted. In addition to the
Salpeter case (s = 2.35), other IMF power-law coefficients are
explored, as labeled on the plot. The value of B is given in
units of (Lsunyr)-1.
|
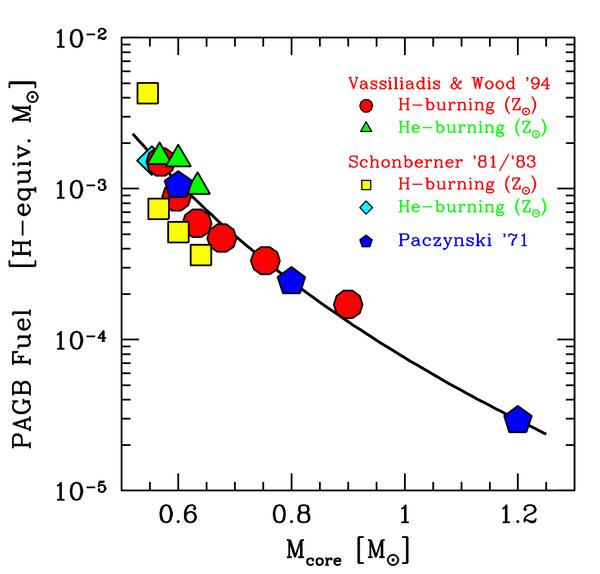 |
Figure 2 -
Theoretical fuel consumption for stars along the PAGB evolution
according to different model sets: Paczynski (1971; pentagon
markers), Schönberner (1981, 1983; squares and
rhombs), Vassilias & Wood (1994; dots and triangles). The different
markers for the same model source refer to the prevailing case of a H
or He thermal pulse terminating the AGB evolution, as labeled. Fuel is
expressed in Hydrogen-equivalent solar mass, i.e. 1g of H-equivalent
mass = 6x10¹⁸ ergs (cf. Renzini & Buzzoni 1986),
and a solar metallicity is assumed in the models. A smooth analytical relation
matching the data, according to eq. (5) is plotted as a solid curve.
|
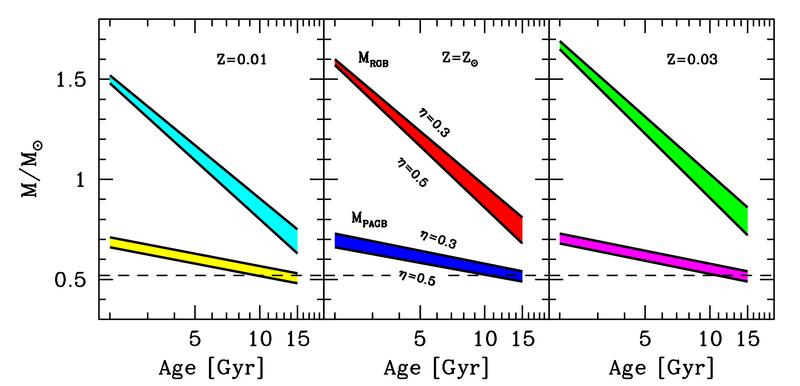 |
Figure 3 -
Time evolution of the stellar mass at some tipping points
across the H-R diagram for SSPs of different metallicity Z, about
the solar value, as labeled in each panel. Upper strips in each panel
are the theoretical loci for stellar mass at the tip of the RGB
evolution, (MRGB) according to a Reimers mass loss parameter
in the range 0.3 ≤ η ≤ 0.5, as labeled in the middle panel,
for general reference. Lower strips mark the locus for stellar mass at
the onset of PAGB evolution (MPAGB), again for the same
reported range of the mass loss parameter η. The minimum mass for
stars to reach the AGB thermal pulsing phase (and eventually produce a
PN) is marked by the dashed line, according to Dorman et al. (1993) and
Blöcker (1995).
|
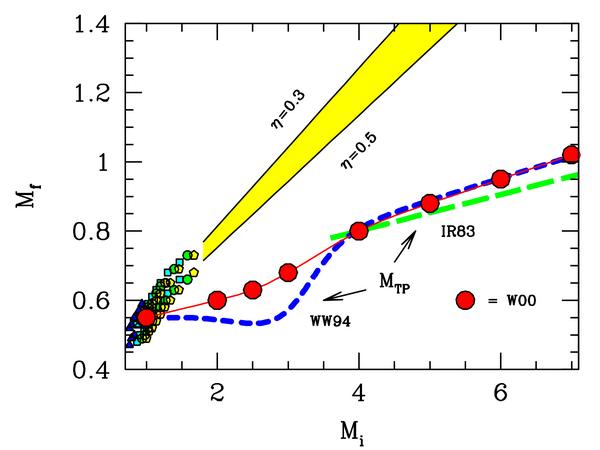 |
Figure 4 -
The initial-to-final mass relation according to different
calibrations. The solid strip is the theoretical relation of
Iben & Renzini (1983) for a standard mass loss parameter η in the
range between 0.3 and 0.5, as labeled on the plot. Small dots report
the individual values as from the Buzzoni (1989)
SSP models of Table 1 and the same Reimers parameters. Short- and
long-dashed curves are the theoretical loci for stars to set on the
AGB thermal pulsing phase (MTP), according to Iben & Renzini (1983)
and Wagenuber & Weiss (1994) (WW94). Finally, big dots and solid curve report the
Weidemann (2000) empirical relation based on the mass estimate
of white dwarfs in Galactic open cluster.
|
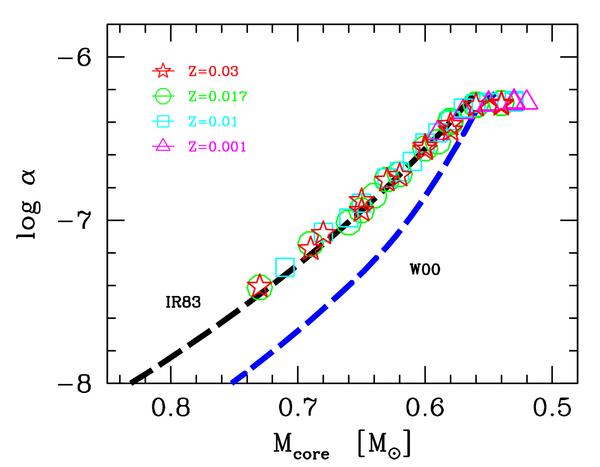 |
Figure 5 -
The luminosity-specific PN number for SSP models of
Table 1 (both for η = 0.3 and 0.5 and different
metallicity, as reported top left) compared to the PAGB stellar core
mass. Overplotted are also the expected calibration assuming the
theoretical IFMR of Iben & Renzini (1983) and the empirical one from
Weidemann (2000), as labeled. Note the clean relationship in
place, with Mcore being the leading parameter to constrain α.
|
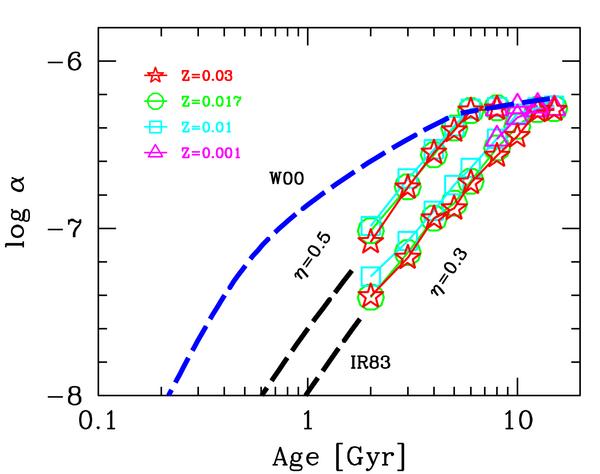 |
Figure 6 -
Theoretical time evolution of the luminosity-specific PN number
for SSP models of Table 1 (both for = 0.3 and
0.5 and the different metallicity values, as labeled top left on the
plot) compared to the expected calibrations assuming the theoretical
initial-to-final mass relation of Iben & Renzini (1983) and the empirical one from
Weidemann (2000).
|
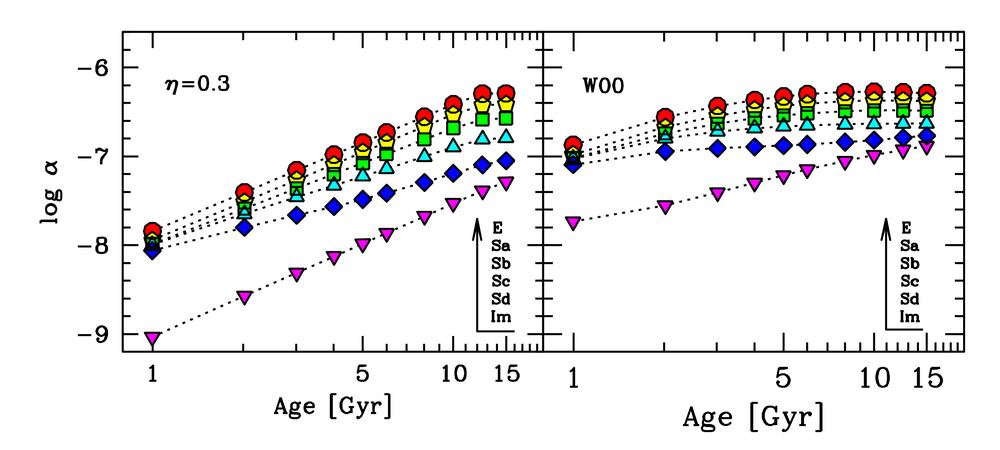 |
Figure 7 -
Theoretical time evolution of the luminosity specific PN
density (α) for the Buzzoni (2005)
template galaxy models along
the whole E-Sa-Sb-Sc-Sd-Im Hubble morphological sequence. Models in
left panel assume an IFMR as from the standard mass loss parameter
η = 0.3, while those in the right panel rely on the empirical
relation from Weidemann (2000). Note, in the latter case, the
much shallower evolution of α. In the two panels,
bulge-dominated spirals tend to approach the evolution of ellipticals
at early epochs due to the increasing bulge contribution to the global
galaxy luminosity.
|
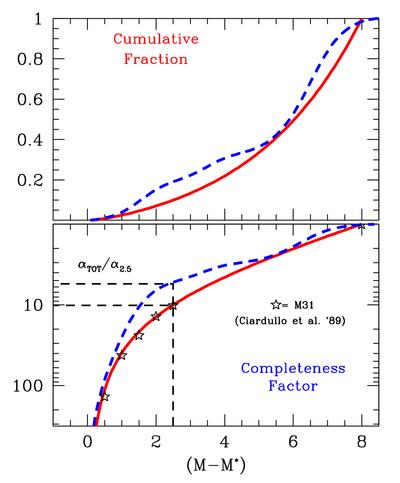 |
Figure 8 -
Upper panel: the cumulative fraction of PNe in the different
magnitude bins with respect to the luminosity-function bright cut-off (M*)
for the double-exponential fit of the PNLF, as in eq. (18)
(solid curve) and for the empirical SMC luminosity function
according to Jacoby (2005) (dashed curve).
Lower panel: completeness factor (CF = Ntot/N(M-M*))
for the same calibrations as in the upper panel. Also reported are the Ciardullo et al. (1989)
data for M 31 (star markers), and the relevant correction factor for the
α2.5 parameter. For better convenience, data are also listed in
Table 3.
|
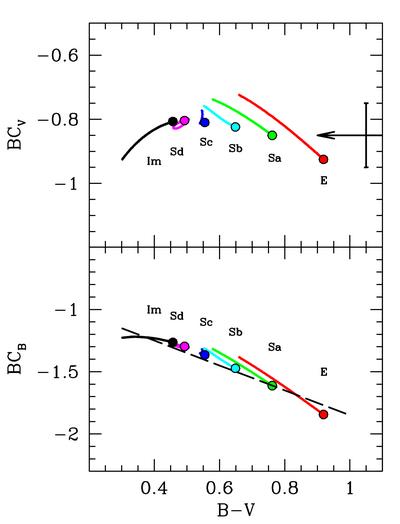 |
Figure 9 -
The expected bolometric correction for theoretical template
galaxy models according to Buzzoni (2005).
The models for different morphological
type span the age range from 1 to 15 Gyr (the latter limit being marked by the
solid dot on each curve). Bolometric correction refers to the V
(upper panel) and B band (lower panel). A value of
(Bol &minus V) = BCV = −0.85 mag can be taken
as a representative correction
for the whole galaxy types within a 10% uncertainty, as shown by the arrow
on the upper plot. This also translates into BCB =−0.85−
(B−V)gal for the B-band correction, as displayed by the dashed
line in the lower panel.
|
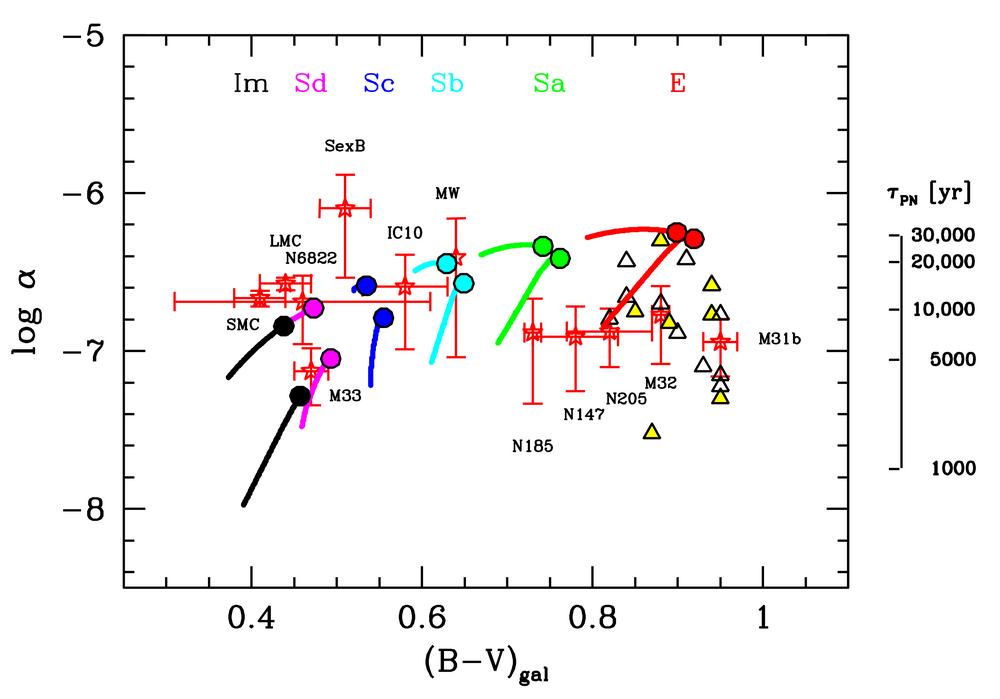 |
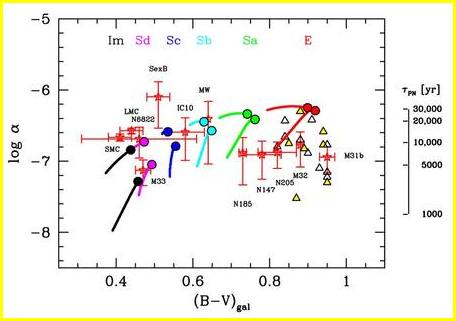
Figure 10 -
A comprehensive overview of the luminosity-specific PN number
in Local Group galaxies (star markers) and external ellipticals from Table 5
(solid triangles) and Table 6 (open triangles). PN data for local galaxies are
from Table 4, and are based on the "Local Group Census
Project" of Corradi et al. (2005). Also superposed on the plot, there are the
Buzzoni (2005) template galaxy models,
as summarized in Table 2.
Galaxy evolution is tracked by models along the whole E-Sa-Sb-Sc-Sd-Im
Hubble morphological sequence from 5 to 15 Gyr, with the latter limit
marked by the big solid dots. Two model sequences are reported on the
plot assuming an IFMR as from the standard case of a Reimers mass loss
parameter η = 0.3 (lower sequence), and from the empirical
relation of Weidemann (2000) (upper sequence). For the
Widemann (2000) models, the relevant data of Table 2
have been corrected by Δ(B-V) = −0.02 mag and
log α = log αW+0.04, according to the
arguments of footnote (5). An indicative estimate of the mean representative
PN lifetime (in years) is sketched on the right scale, according
to eq. (22).
|
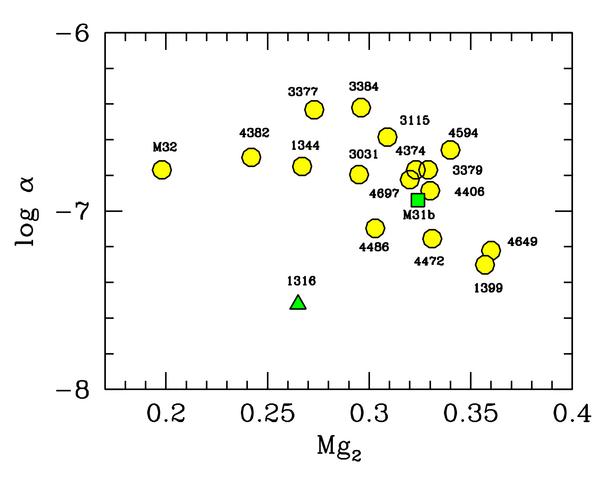 |
Figure 11 -
The observed distribution of the elliptical galaxy sample of
Table 6 (plus M 32 and the bulge of M 31, as labeled on
the plot) versus Lick spectrophotometric index Mg2. Note the
relative lack of PNe (per unit galaxy luminosity) in more metal rich
ellipticals. The relevant case of the merger galaxy NGC 1316 is
singled out, while the active star forming elliptical NGC 205 is
out of range with Mg2≤ 0.1 and not shown. See text for a discussion.
|
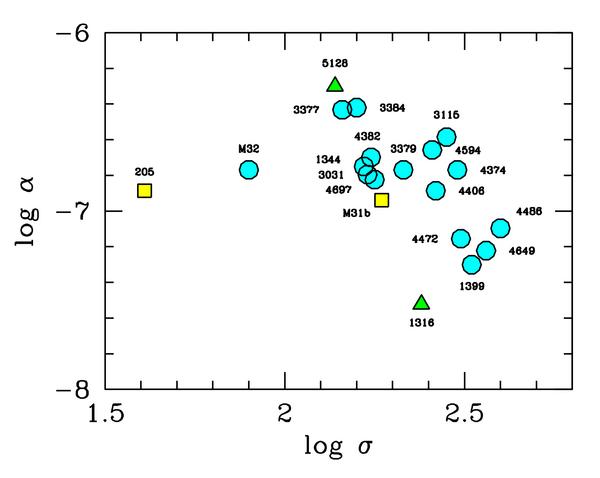 |
Figure 12 -
Same as Fig. 11, but for the galaxy velocity
dispersion σ in km s-1. It is evident a lower value of
α in high-σ (roughly more massive) galaxies. See text
for further details.
|
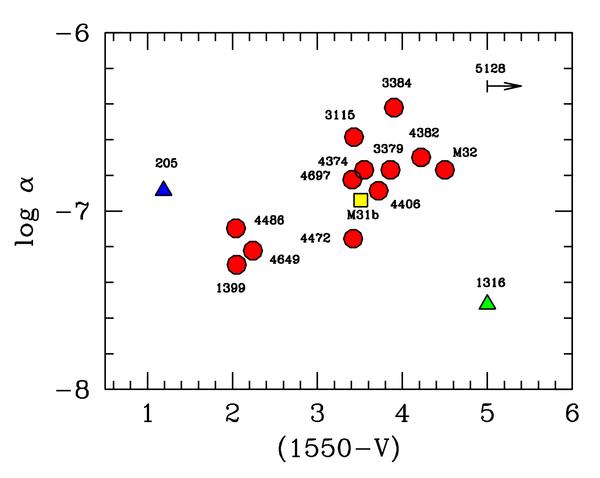 |
Figure 13 -
The luminosity-specific PN number versus ultraviolet color
(1550−V), as originally defined by Burstein et al. (1988), for the
elliptical galaxy sample of Table 6 (plus the Andromeda
satellites and the bulge of M 31). Some relevant cases, like NGC 205
(star forming), NGC 1316 and NGC 5128 (merger ellipticals) are singled
out on the plot. Note the tight relationship between "quiescent"
ellipticals and α, with UV-bright galaxies to be also
PN-poor. See text for a full discussion of this important effect.
|
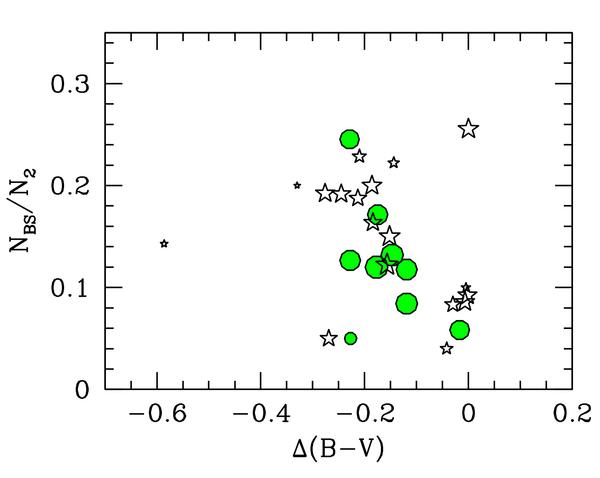 |
Figure 14 -
The blue shift of the integrated B−V color of old open clusters in the Galaxy
caused by the BS stellar population, from Xin & Deng (2005). The BS component
(NBS)
is normalised in terms of its ratio to the number of MS stars down to 2 mag below the
TO luminosity (N2). Solid dots are for the oldest (t ≥5 Gyr)
clusters, while star markers include clusters with 1 ≤ t < 5 Gyr.
Symbol size is proportional to cluster statistical richness.
|
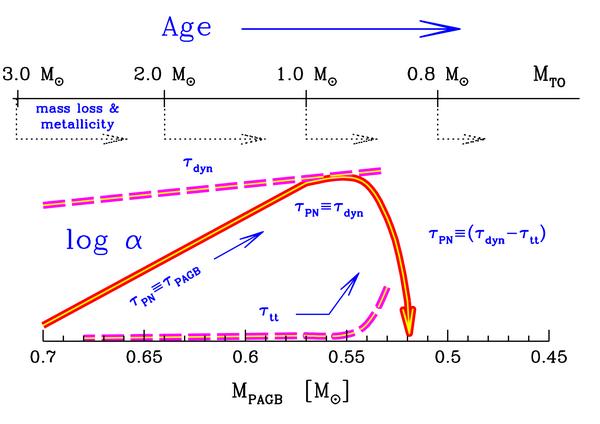 |
Figure 15 -
A representation of the envisaged PN evolution versus core
mass of PAGB stars. The effect of different parameters, like
metallicity, mass loss and age is outlined. In particular three
evolutionary regimes are singled out, with PN visibility lifetime
τPN (and correspondingly α) constrained respectively
by the nuclear timescale (τPAGB), shell dynamics
(τdyn), and transition time (τtt). PN
visibility drastically reduces for Mcore ≤ 0.55 Msun
until reaching a critical limit for PN formation about
Mcore ~ 0.52 Msun. See text for full discussion.
|
Back to article listing |
|
Shortcut to the SSP models |
| AB/Mar 2006 |
|
|