Back to article listing

Back to article listing |
|
Shortcut to the SSP models |
| Buzzoni, A., Bertone, E., Carraro, G., and Buson, L.: |
| "Stellar lifetime and ultraviolet properties of the old
metal-rich Galactic open cluster NGC6791: a pathway to understand the UV upturn of elliptical galaxies", 2012, Astrophysical Journal, 749, 35 |
|
|
Summary:
The evolutionary properties of the old metal-rich Galactic open
cluster NGC6791 are assessed, based on deep UB photometry and 2Mass
JK data. For 4739 stars in the cluster, bolometric luminosity and effective
temperature have been derived from theoretical (U-B) and (J-K) color fitting.
The derived H-R diagram has been matched with
the UVBLUE grid of synthetic stellar spectra to obtain the integrated SED of
the system, together with a full set UV (Fanelli) and optical (Lick)
narrow-band indices.
The total bolometric magnitude of NGC6791 is Mbol6791= -6.29, with a color (B-V)6791 = 0.97. The cluster appears to be a fairly good proxy of standard elliptical galaxies, although with significantly bluer infrared colors, a shallower 4000 Å Balmer break, and a lower Mg2 index. The confirmed presence of a dozen hot stars, along their EHB evolution, leads the cluster SED to consistently match the properties of the most active UV-upturn galaxies, with 1.7±0.4% of the total bolometric luminosity emitted shortward of 2500 Å. The cluster Helium abundance results Y6791 = 0.30 ±0.04, while the Post-MS implied stellar lifetime from star number counts fairly agrees with the theoretical expectations from both the Padova and BASTI stellar tracks. A Post-MS fuel consumption of 0.43±0.01 Msun is found for NGC6791 stars, in close agreement with the estimated mass of cluster He-rich white dwarfs. Such a tight figure may lead to suspect that a fraction of the cluster stellar population does actually not reach the minimum mass required to effectively ignite He in the stellar core. |
| Pick up the paper at Astro-ph/1202.4461 | Local link to the PDF version (845 Kb) | ||
| Enhanced HTML/PDF version at the ApJ site (*) | |||
| (*)May require access password |
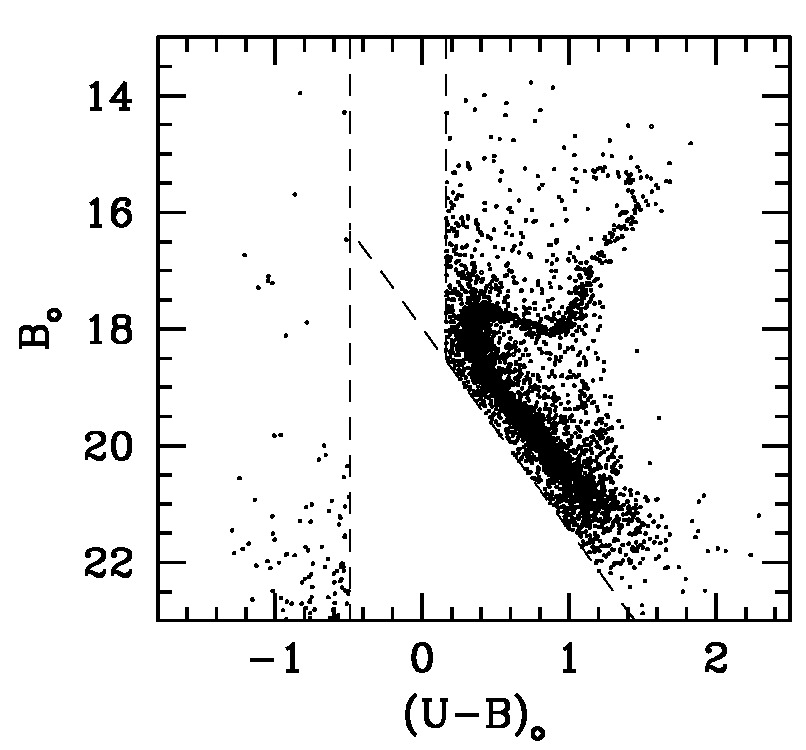 |
Figure 1 -
The observed B vs. (U-B) c-m diagram of NGC6791, according to our deep TNG
photometry. Magnitude and color have been corrected for reddening according to
Twarog et al. (2009). To statistically pick up the genuine cluster stellar population
we applied to the plot a selection in the observed (i.e. non-dereddened) color domain
by rejecting as possible field interlopers all the stars included in a -0.4 ≤(U-B)≤+0.25
color strip plus those objects lying below the MS locus, as sketched in the diagram.
|
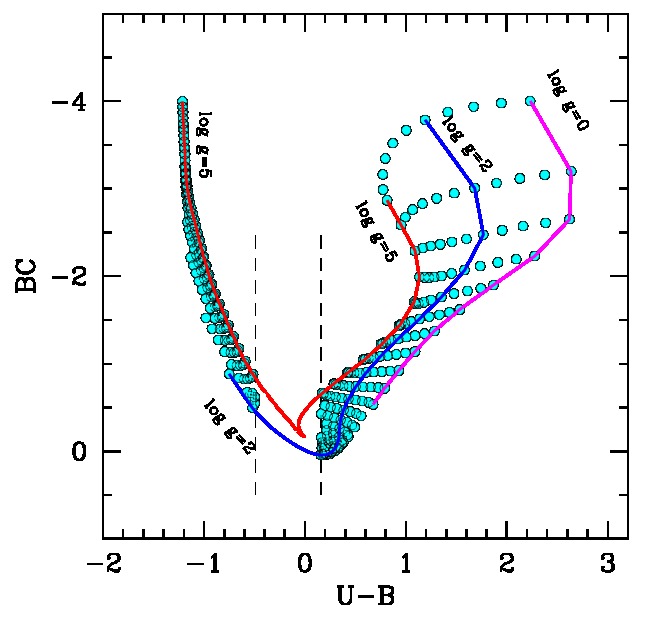 |
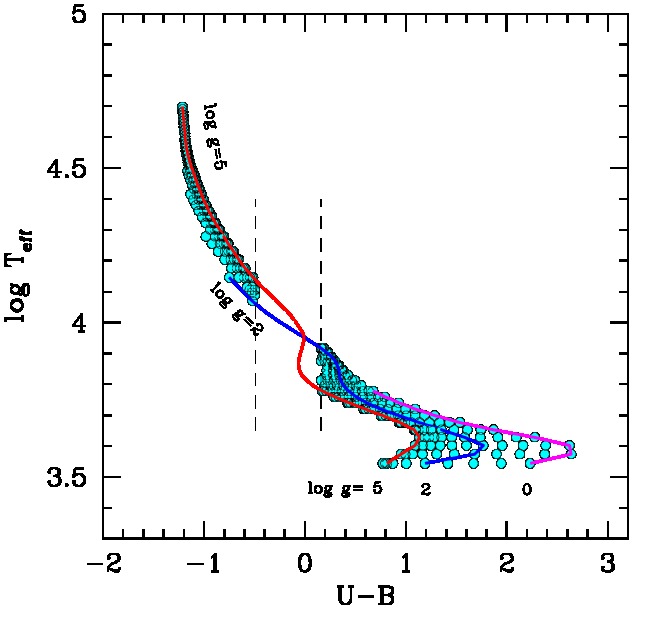
Figure 2 -
Theoretical relationship between (U-B) color, effective temperature (upper panel)
and B-band bolometric correction (lower panel) for stars with [Fe/H] = +0.4
according to the UVBLUE grid of synthetic stellar spectra Rodriguez-Merino et al. (2005)
in its updated version with the Castelli et al. (2003) revised chemical opacities.
The model sequences for fixed values of surface gravity, namely log g = 0, 2 (giants),
and 5 (dwarfs) are singled out and labelled on the plots for reader's better reference.
The assumed "zone of avoidance" for field interlopers has been marked in each grid.
|
 |
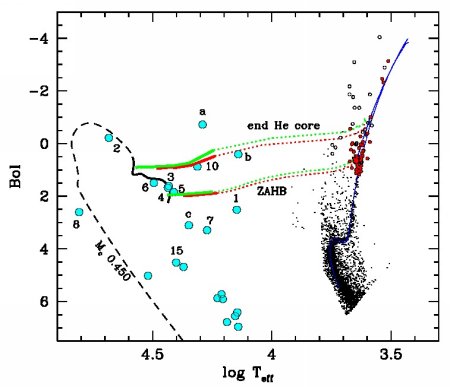
Figure 3 -
The derived H-R diagram of NGC6791. Big (blue) dots mark the hot stellar component with
Teff ≥ 10,000 K. When available, stars are labelled with their ID number from the
Kaluzny et al. (1992) catalog. Three new stars, consistent with hot-HB evolution, appear
in our survey and are labelled with "a", "b", and "c" in the plot.
Small dots in the red-giant region of the diagram indicate the 94 2Mass stars that integrated
our UB photometry, as discussed in the text. Of these, the 61 stars in common with the UB
sample appear as (red) solid dots. The theoretical isochrones from the
Padova database (Bertelli et al. 2008) for (Z,Y) = (0.04, 0.34) and t = 6 and 8~Gyr
are overplotted to the data, together with the expected HB evolutionary strip between
the ZAHB locus as a lower edge and the He core exhaustion locus as an upper envelope.
Calculations for HB models are from the BASTI database (Pietrinferni et al. 2007)
for a (Z,Y) = (0.04, 0.30) chemical mix with solar-scaled (red curve, from Pietrinferni et al. 2004)
and α-enhanced (green curve, from Pietrinferni et al. 2006) metal partition.
The case of a 0.45 Msun star evolving as an EHB (and AGB-manqué) object
is also displayed in some detail (thick black solid line), according to D'Cruz et al. (1996) for
[Fe/H] = +0.37. See text for a discussion.
|
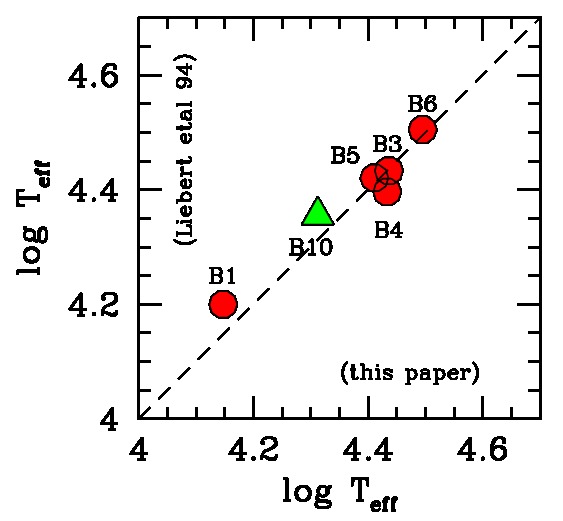 |
Figure 4 -
The Liebert et al. (1994) temperature scale from high-resolution spectroscopy
is compared with our (U-B)-based calibration for the five hot stars in the
Kaluzny et al. (1992) list, as labelled (big dots). One more star in the list
(B10) has been made available from the Landsman et al. (1998) spectroscopy and has been
added to the plot (big triangle).
Spectroscopic temperature estimates are confidently reproduced by our photometric
calibration within a ±7% (1 σ) relative scatter.
|
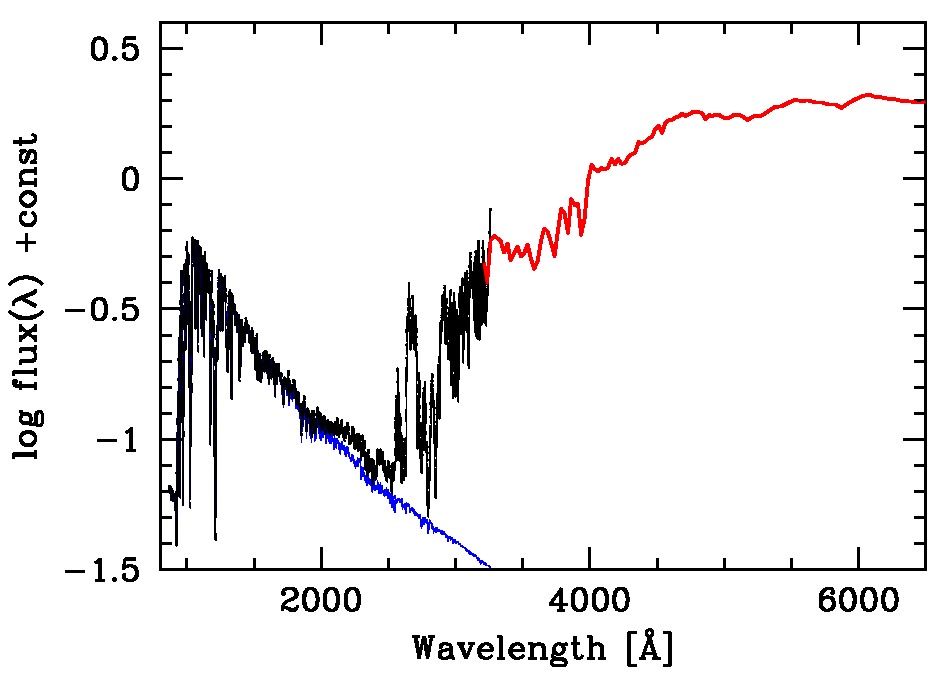 |
Figure 5 -
Representative parameters for the observed (dots) and predicted (squares)
AThe synthetic SED of NGC6791. The integrated spectrum is obtained by summing up the
contribution of our bona fide star sample of 4739 entries.
Mid-UV (λ ≤ 3200 Å) spectral synthesis has been carried out at high
resolution (2 Å FWHM) by attaching each star the corresponding UVBLUE synthetic
spectrum with the same fundamental parameters (black line). Same procedure has been adopted
at longer wavelength (red line), by matching the Kurucz' (1993) Atlas9 library
at low resolution (~25 Å). The selective contribution of hot (Teff ≥ 10,000K)
is singled out (blue line) showing that these stars are the prevailing contributors to the
striking UV upturn in this SED. According to our estimate (see eq. 6)
this feature collects about 1.7±0.4% of the total bolometric luminosity
of the cluster.
|
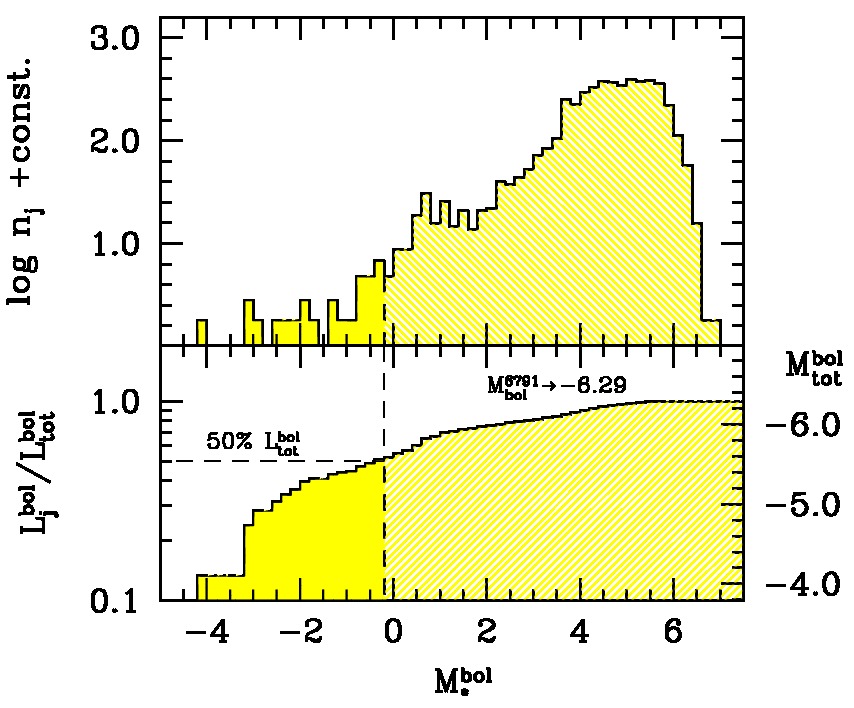 |
Figure 6 -
Upper panel - The bolometric luminosity function of the NGC6791 stellar population
according to the c-m diagram of Fig. 3.
Lower panel - The cluster integrated magnitude obtained by summing up stars with
increasingly fainter bolometric luminosity. An asymptotic value of Mboltot = -6.29
is reached, when including all the 4739 stars in our sample. Note the outstanding contribution
of the few bright stars with negative value of Mbol* (some 30 objects in total),
which provide about 50% of cluster total luminosity.
|
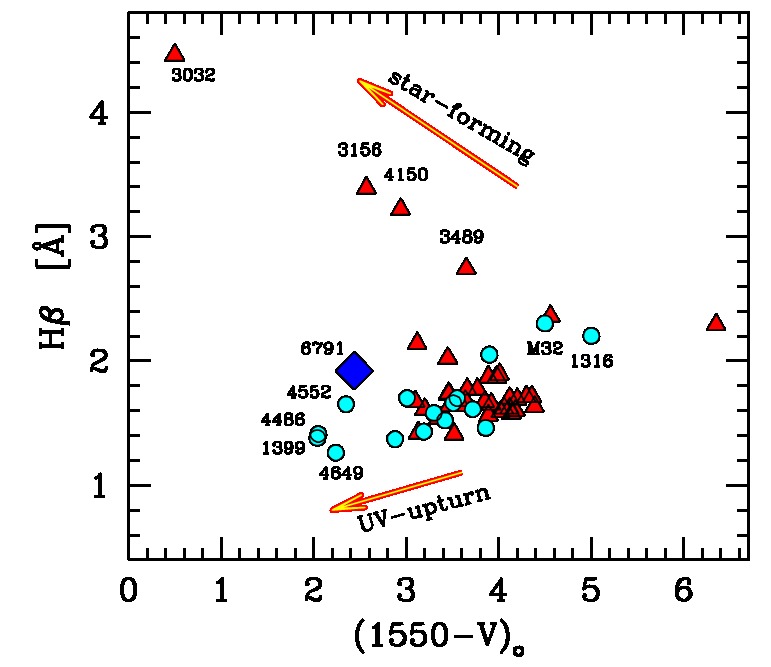 |
Figure 7 -
A comparison of the NGC6791 location in the Hβ index vs. (1550-V) UV color
(big romb marker, as labelled) is carried out with a set of elliptical galaxies along a
range of evolutionary cases. The Bureau et al. (2011) SAURON database of 41 ellipticals
with available GALEX UV photometry is displayed (triangles) together with the
original IUE sample of Burstein et al. (1988), as recompiled by Buzzoni & Gonzalez-Lopezlira (2008)
(18 galaxies with available Lick indices) (solid dots).
Some reference objects are singled out and labelled for better clarity (see text for
a discussion). A clear ">"-shaped pattern of galaxy distribution is in place, with
mildly star-forming systems displaying a stronger (≥ 2Å) Hβ index, contrary to
UV-upturn galaxies, which supply the same UV emission with a much shallower Hβ
absorption. Note the resemblance of NGC6791 with the case of galaxy NGC4552.
|
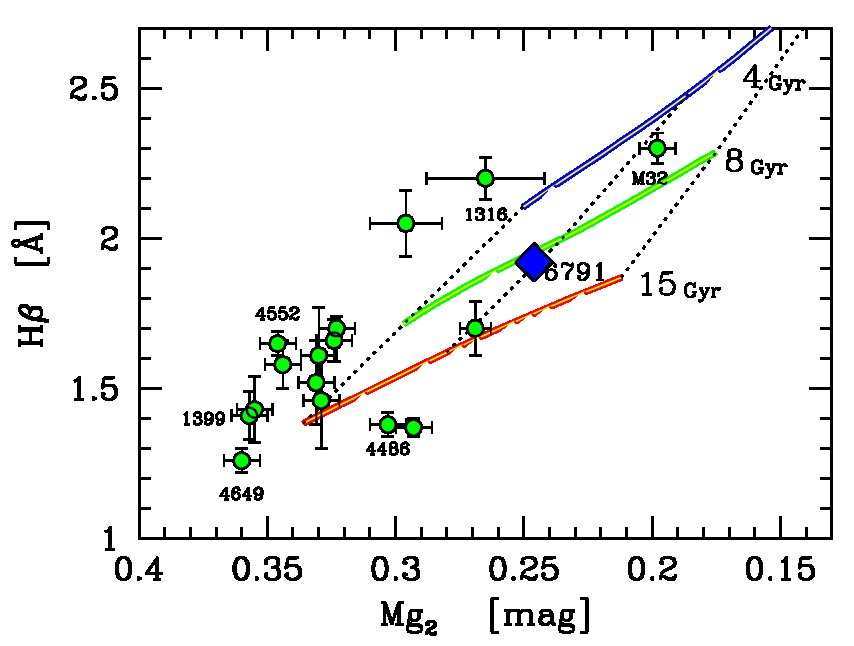 |
Figure 8 -
The Buzzoni & Gonzalez-Lopezlira (2008) compiled sample of elliptical galaxies is displayed
in the classical diagnostic plane of the Hβ vs. Mg2 Lick indices, together
with the corresponding location for NGC6791 (big romb marker). Observations are compared
with the Buzzoni (1989) and Buzzoni (1995) population synthesis models (with Y = 0.25) for an age of
4, 8 and 15 Gyr as labelled (solid lines), and for a metallicity parameter
[Fe/H] = -0.5, 0.0, and +0.5, in the sense of increasing Mg2 (dotted line envelope).
In spite of its recognized value of [Fe/H]~+0.4, NGC6791 appears to match here
only a marginally super-solar metallicity due to its relatively low value of
Mg2. This is in consequence of the scanty population of RGB+AGB stars,
a feature that we may adscribe to the speeded-up RGB evolution induced by Helium
overabundance. See text for a discussion.
|
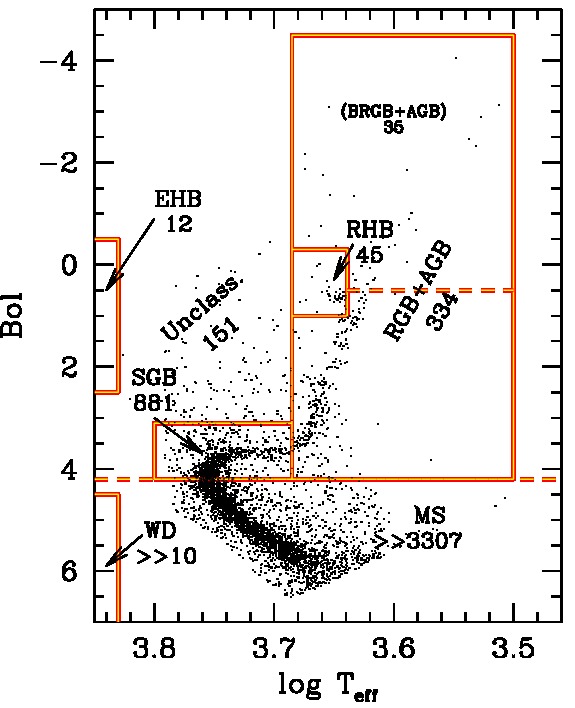 |
Figure 9 -
A zoomed-in sketch of the cluster H-R diagram with the selection scheme to pick up
stars in the different evolutionary stages. The relevant star number counts (proportional
to the evolutionary lifetime for PMS stars, according to eq. 9 are reported
in the different boxes, as summarized in better detail also in Table 3.
|
Back to article listing |
|
Shortcut to the SSP models |
| AB/Jun 2012 |
|
|