Back to article listing

Back to article listing |
|
Shortcut to Space Stuff |
| Colas, F. et al. (w/ Buzzoni, A.): |
| "FRIPON: a worldwide network to track incoming meteoroids" 2020, Astronomy & Astrophysics, 644, A53 |
|
|
Summary:
Until recently, camera networks designed for monitoring fireballs worldwide were not fully automated, implying that in case
of a meteorite fall, the recovery campaign was rarely immediate. This was an important limiting factor as the most fragile hence
precious meteorites must be recovered rapidly to avoid their alteration.
The Fireball Recovery and InterPlanetary Observation Network (FRIPON) scientific project was designed to overcome this limitation. This network comprises a fully automated camera and radio network deployed over a significant fraction of western Europe and a small fraction of Canada. As of today, it consists of 150 cameras and 25 European radio receivers and covers an area of about 1.5 × 10⁶ km2. The FRIPON network, fully operational since 2018, has been monitoring meteoroid entries since 2016, thereby allowing the characterization of their dynamical and physical properties. In addition, the level of automation of the network makes it possible to trigger a meteorite recovery campaign only a few hours after it reaches the surface of the Earth. Recovery campaigns are only organized for meteorites with final masses estimated of at least 500 g, which is about one event per year in France. No recovery campaign is organized in the case of smaller final masses on the order of 50 to 100 g, which happens about three times a year; instead, the information is delivered to the local media so that it can reach the inhabitants living in the vicinity of the fall. Nearly 4000 meteoroids have been detected so far and characterized by FRIPON. The distribution of their orbits appears to be bimodal, with a cometary population and a main belt population. Sporadic meteors amount to about 55% of all meteors. A first estimate of the absolute meteoroid flux (mag < −5; meteoroid size ≥1 cm) amounts to 1250/yr/106 km2. This value is compatible with previous estimates. Finally, the first meteorite was recovered in Italy (Cavezzo, January 2020) thanks to the PRISMA network, a component of the FRIPON science project. |
|
Enhanced HTML/PDF version at the A&Ap site (*) (*) May require access password |
Local link to the PDF version (1 Mb)
(For personal use only) | ||
| Pick up the paper at Astro-ph/2012.00616 |
|
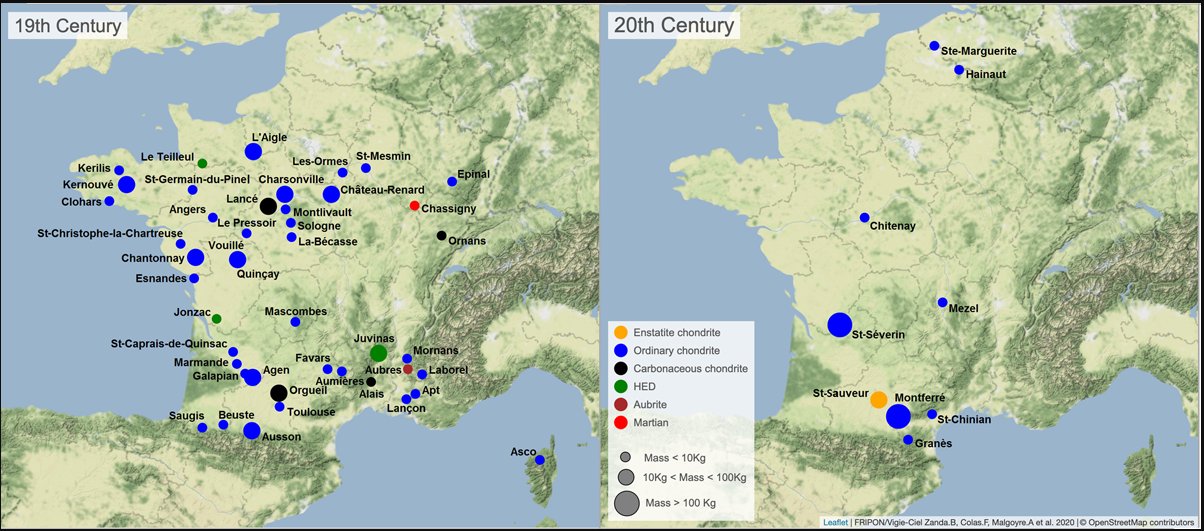
Figure 1 -
Distribution of observed meteorite falls in France. In nineteenth century France, 45 meteorites were recovered after their
fall was observed, a number that fell by a factor of 5 in the twentieth century. Even in the nineteenth century, witnessed
falls were not randomly distributed. They were mostly located in the great river plains (Seine and Loire in the northwest,
Garonne in the southwest, and Rhône valley in the southeast). In these regions, the population was denser, the view is free
of obstacles (such as mountains), and the skies are often clear. The striking difference between the two centuries illustrates
the need for distributed observers for meteorite recovery. Rural populations have declined because of urbanization in the
twentieth century. A camera network such as FRIPON can monitor atmospheric entries and take over that role that was previously
played by human observers. However, trained human eyes are still required to recover the meteorites; this is the aim of the
Vigie-Ciel citizen science program (Colas et al. 2015).
|
|
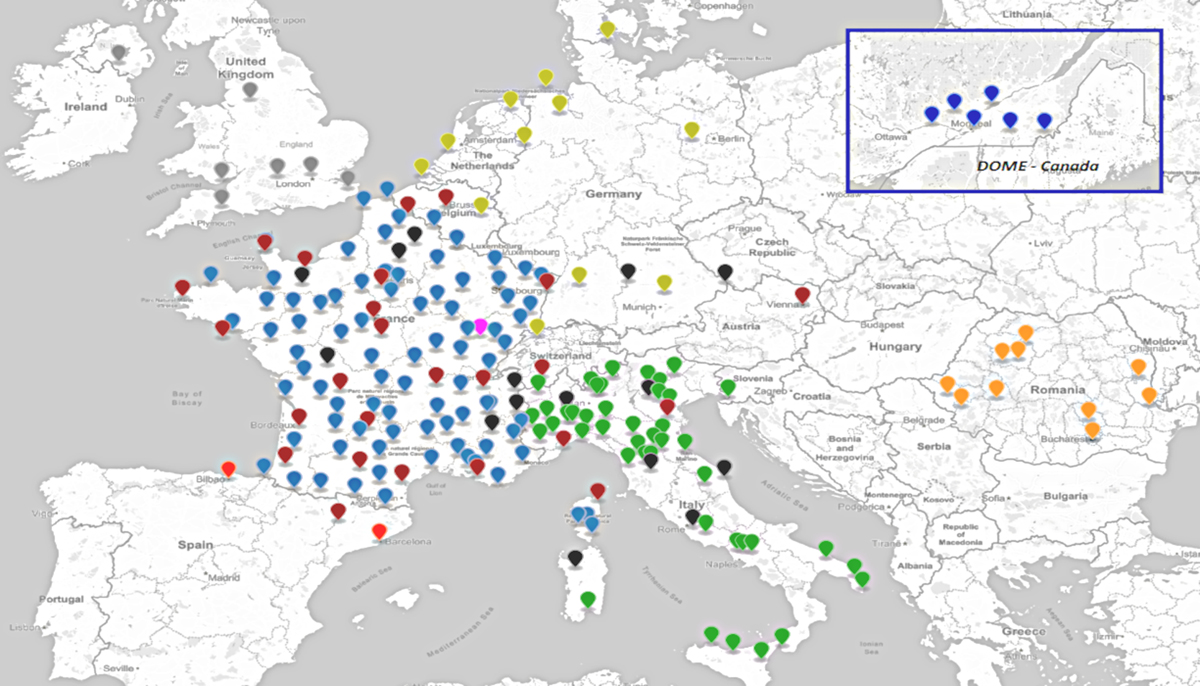
| Figure 2 -
FRIPON network map as of end 2019. The color code is the following: 1. Blue: FRIPON-France, optical stations.
2. Red: coupled optical camera and radio receiver stations. 3. Black: stations under development.
4. Green: PRISMA (Italy). 5. Light Orange: MOROI (Romania). 6. Yellow: FRIPON-Belgium/Neterlands/Germany/Denmark.
7. Gray: SCAMP (United Kingdom). 8. Dark blue: DOME (Canada). 9. Dark Orange: SPMN (Spain). 10. Pink: GRAVES radar.
|
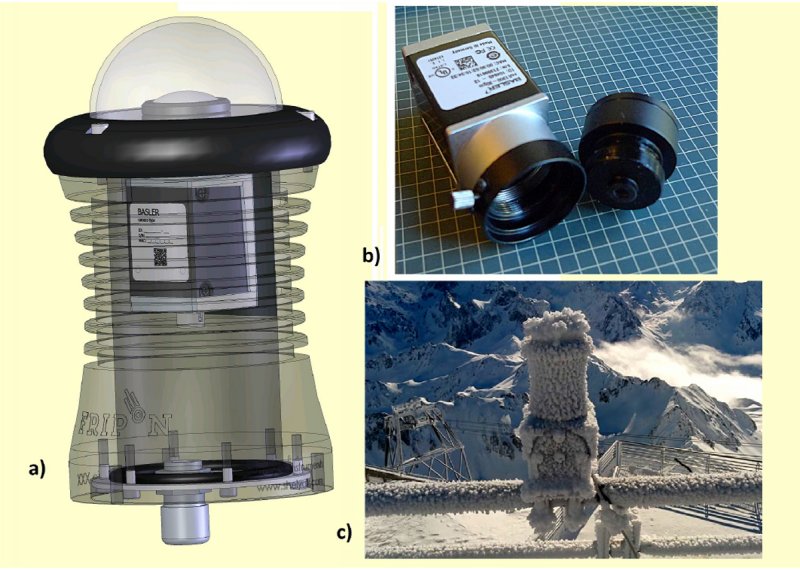 |
Figure 3 -
Mosaic of technology developed for the FRIPON network: (a) Final design of optical detectors2. (b) Core device comprising
a GigaBit Ethernet camera and fish-eye optics. (c) FRIPON optical camera installed on the platform of Pic du Midi Observatory
(2876 m altitude), in use during harsh weather conditions.
|
|
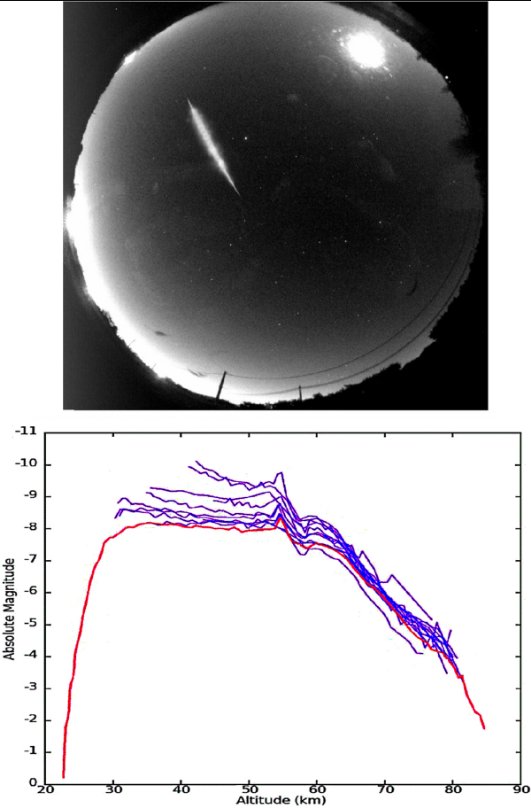
Figure 4 -
Top: event on 27 February 2019 seen by the Beaumont-lès-Valence FRIPON camera.
Bottom: absolute magnitude light curves of the event as seen by 15 cameras; the red curve is Beaumont-lès-Valence.
It is clear that the saturation limit is around magnitude −8 (all the other light curves fall above this limit).
Cameras located further away may be able to measure more non-saturated data, but all the cameras become heavily
saturated as the bolide reaches its maximum luminosity.
|
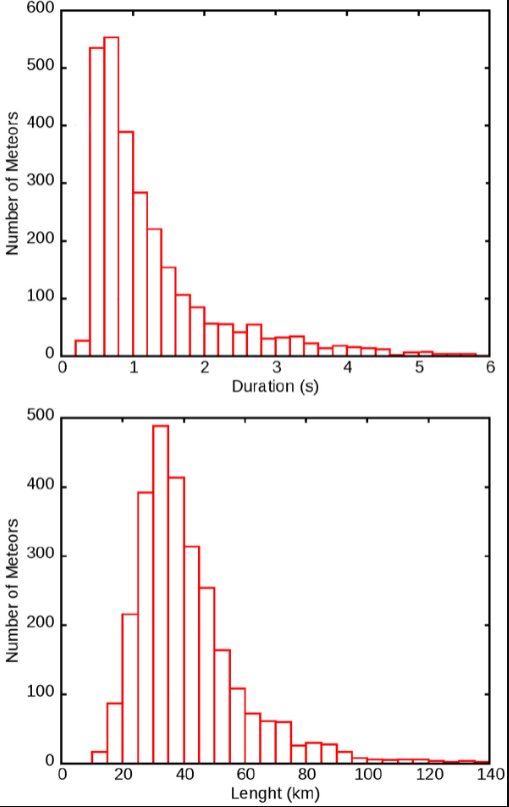 |
Figure 5 -
Distribution of the duration (top) and length (bottom) of 3200 bright flights. The cutoff for short exposures
(less than 0.5 s) is due to the acquisition software FreeTure (Audureau et al. 2014).
|
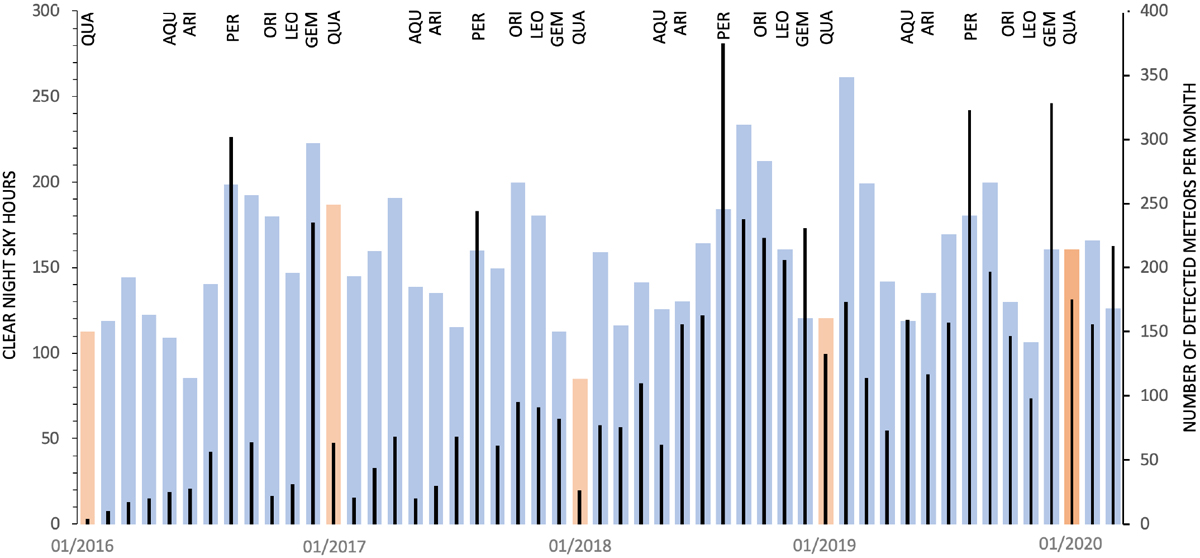 |
Figure 6 -
Detection statistics for the last 3 yr of operation. Of a total of 3700 trajectories computed: double 58%, triple 20%,
quadruple 8%, and more than 4 simultaneous detections 14%. The number of detections (black bars) gradually increases
as the installation of the stations progresses. The blue bars (orange for January) indicate the number of clear night
sky hours each month, making it possible to also visualize the effect of cloud cover. The main meteor showers are listed at the top.
|
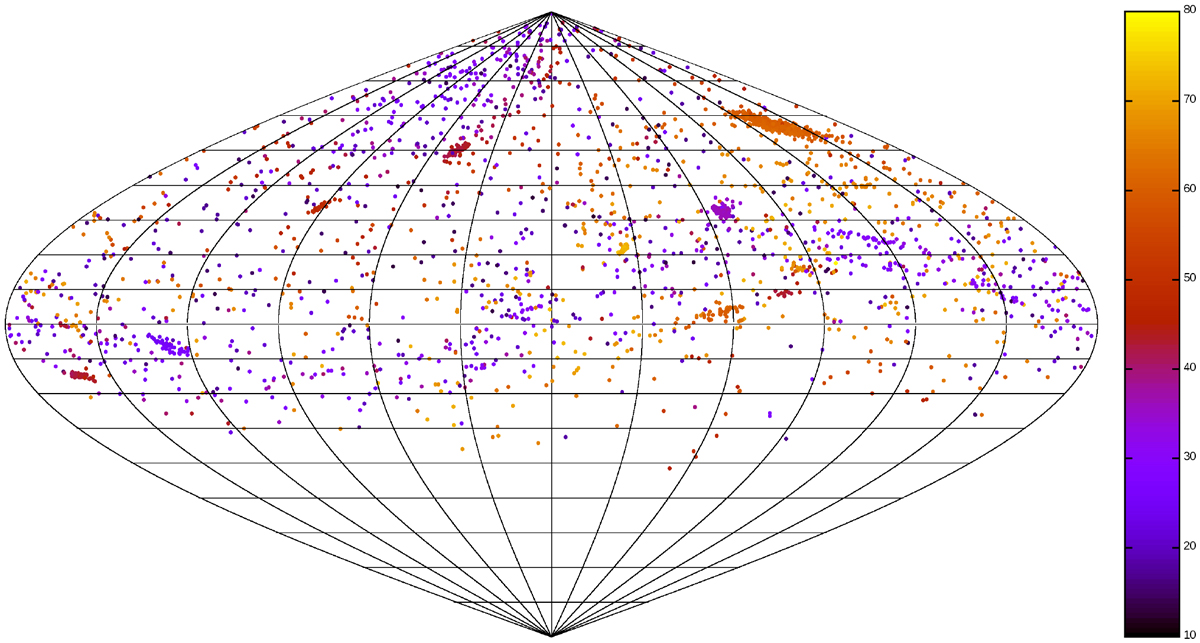 |
Figure 7 -
Fireball radiant in Sanson-Flamsteed projection of equatorial coordinates from January 2016 to December 2019.
The color scale corresponds to the initial velocity of the objects: (1) low velocities (in blue) for asteroidal
like objects, (2) high velocities (in yellow) for cometary-like objects. The main showers are detected. Of the objects,
55% are sporadic: their radiants cover the sky uniformly except for its southern part, which is invisible from
European latitudes. The north toroidal sporadic source is visible in the top left corner and low speed objects
are shown along the ecliptic plane coming from the anti-helion source.
|
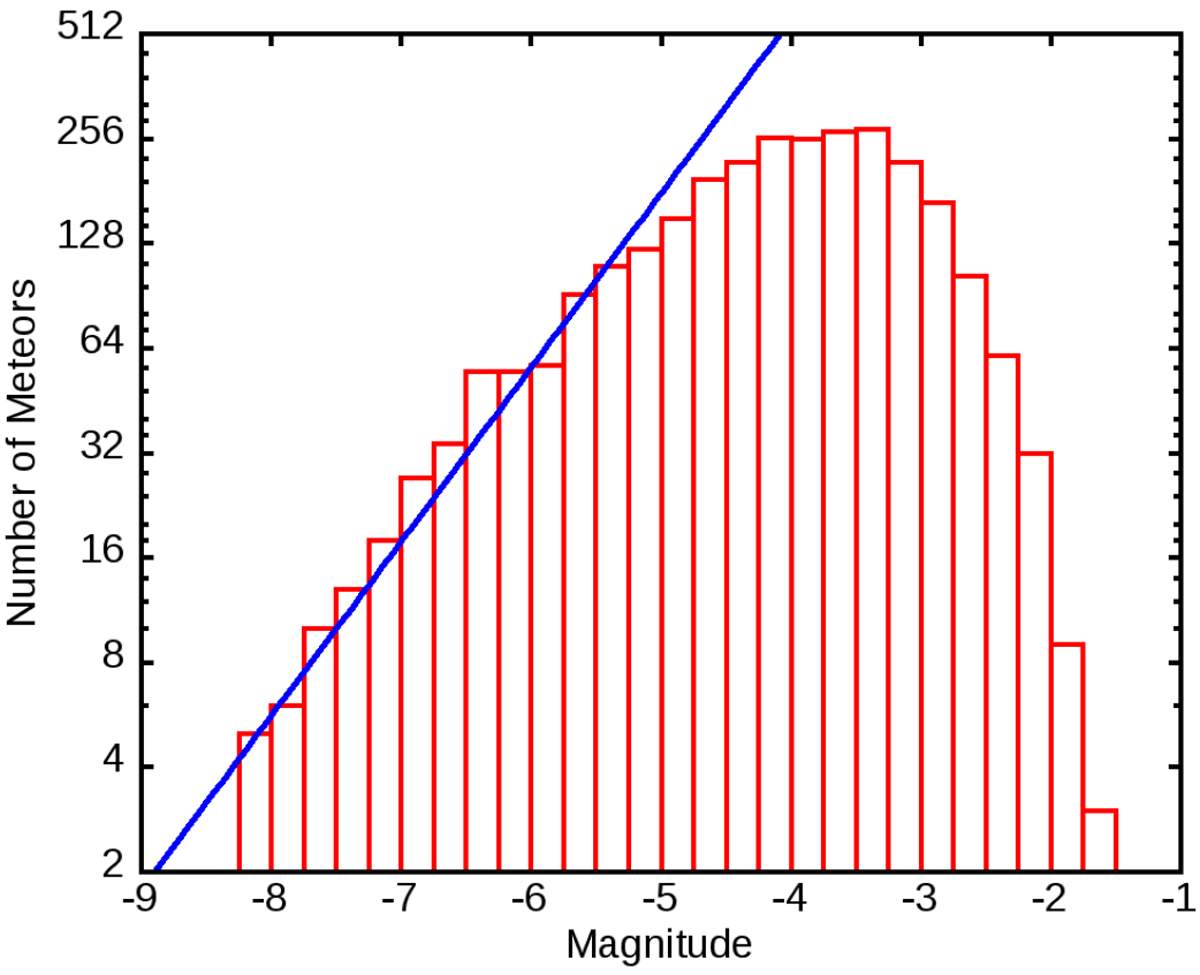 |
Figure 8 -
Histogram of the absolute magnitude of all the events detected by the network showing that the exhaustive detection
regime is only reached around mag −5. The slope is compatible with that obtained by previous studies such as
Brown et al. (2002), as shown on Fig. 11, which describes the distribution of interplanetary matter from 1 cm to 1 km.
The global shape of the histogram is similar to that in Ott et al. (2014), which is shifted as CILBO cameras are more
sensitive than FRIPON cameras.
|
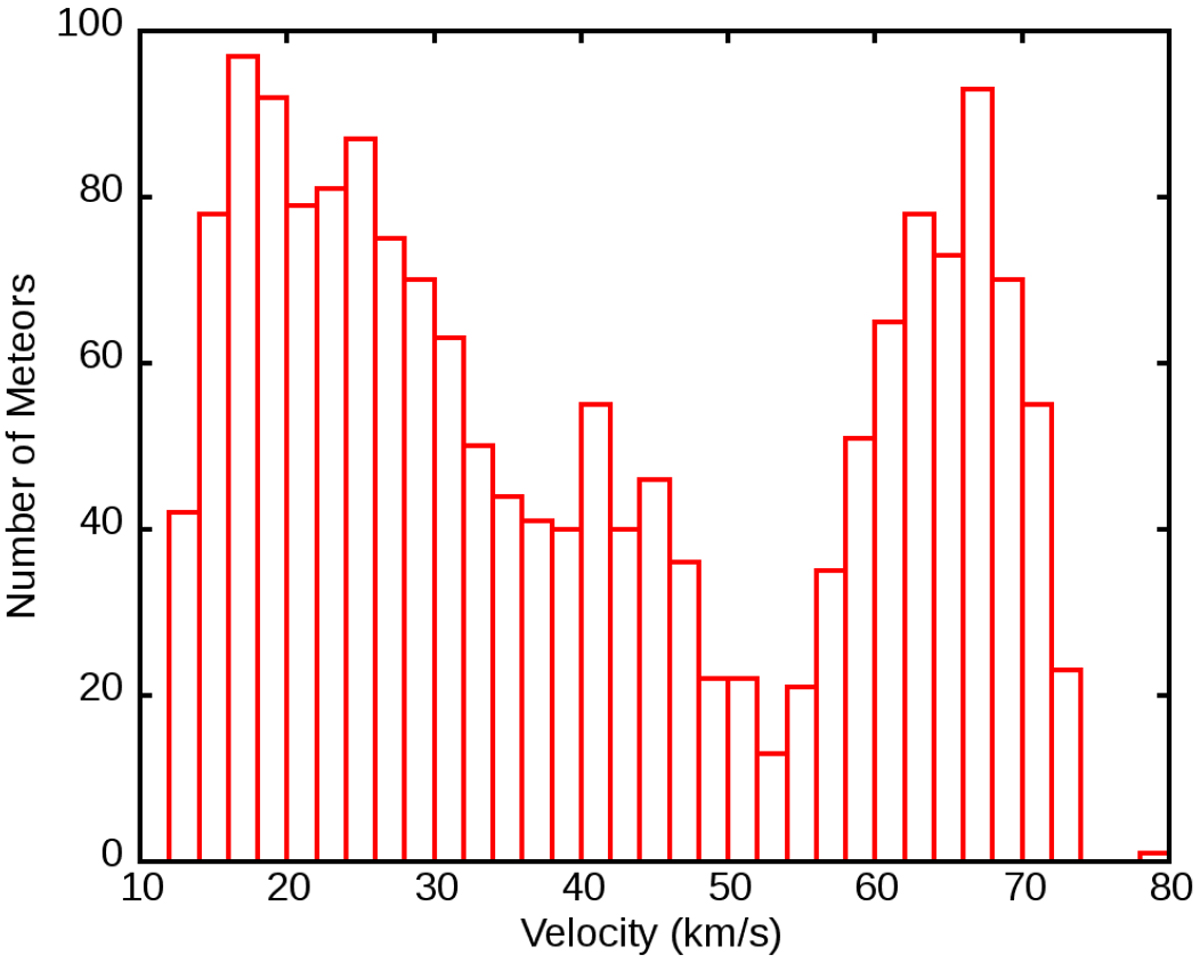 |
Figure 9 -
Histogram of sporadic fireball entry velocities. Two populations can be observed: (1) low speed objects corresponding
mostly to asteroidal orbits and (2) fast objects corresponding to TNOs or comet-like objects. This dichotomy has also
been observed by Drolshagen et al. (2014) with the CILBO network for smaller objects.
|
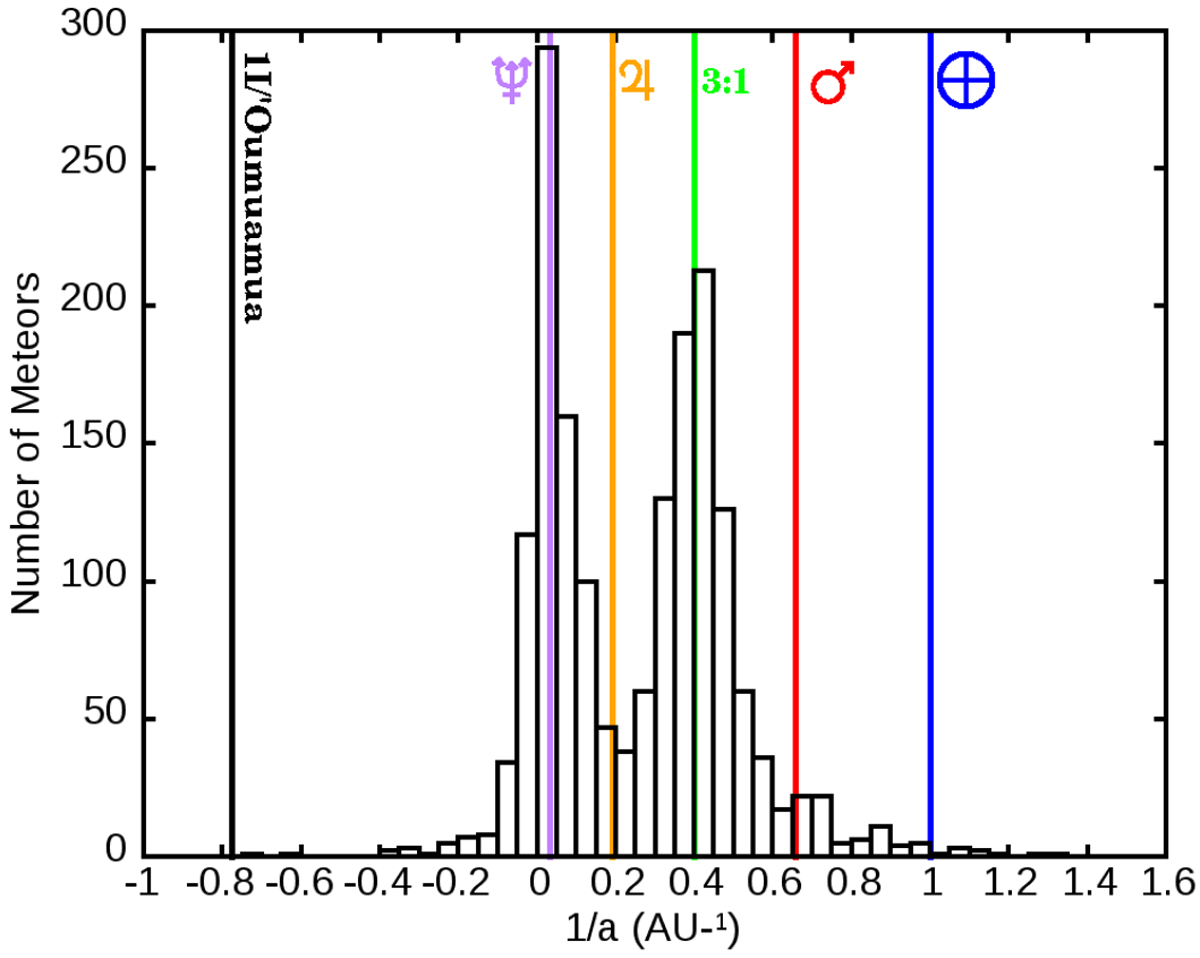 |
Figure 10 -
Histogram of sporadic fireballs detected as a function of 1/a. This value is proportional to the orbital energy,
making it possible to highlight two populations of objects: (1) the slow objects (of asteroidal origin) with a maximum
related to the 3:1 and ν6 resonances (green line), which are the main sources of NEOs; and (2) the fast objects around
Neptune (purple line). These two populations are separated by Jupiter (orange line). The figure also shows the orbits
of the Earth (blue), Mars (red), and the interstellar object 1I/Oumuamua (black). The FRIPON orbits with negative (1/a)
values suffer from large errors and certainly do not correspond to orbits of interstellar objects.
|
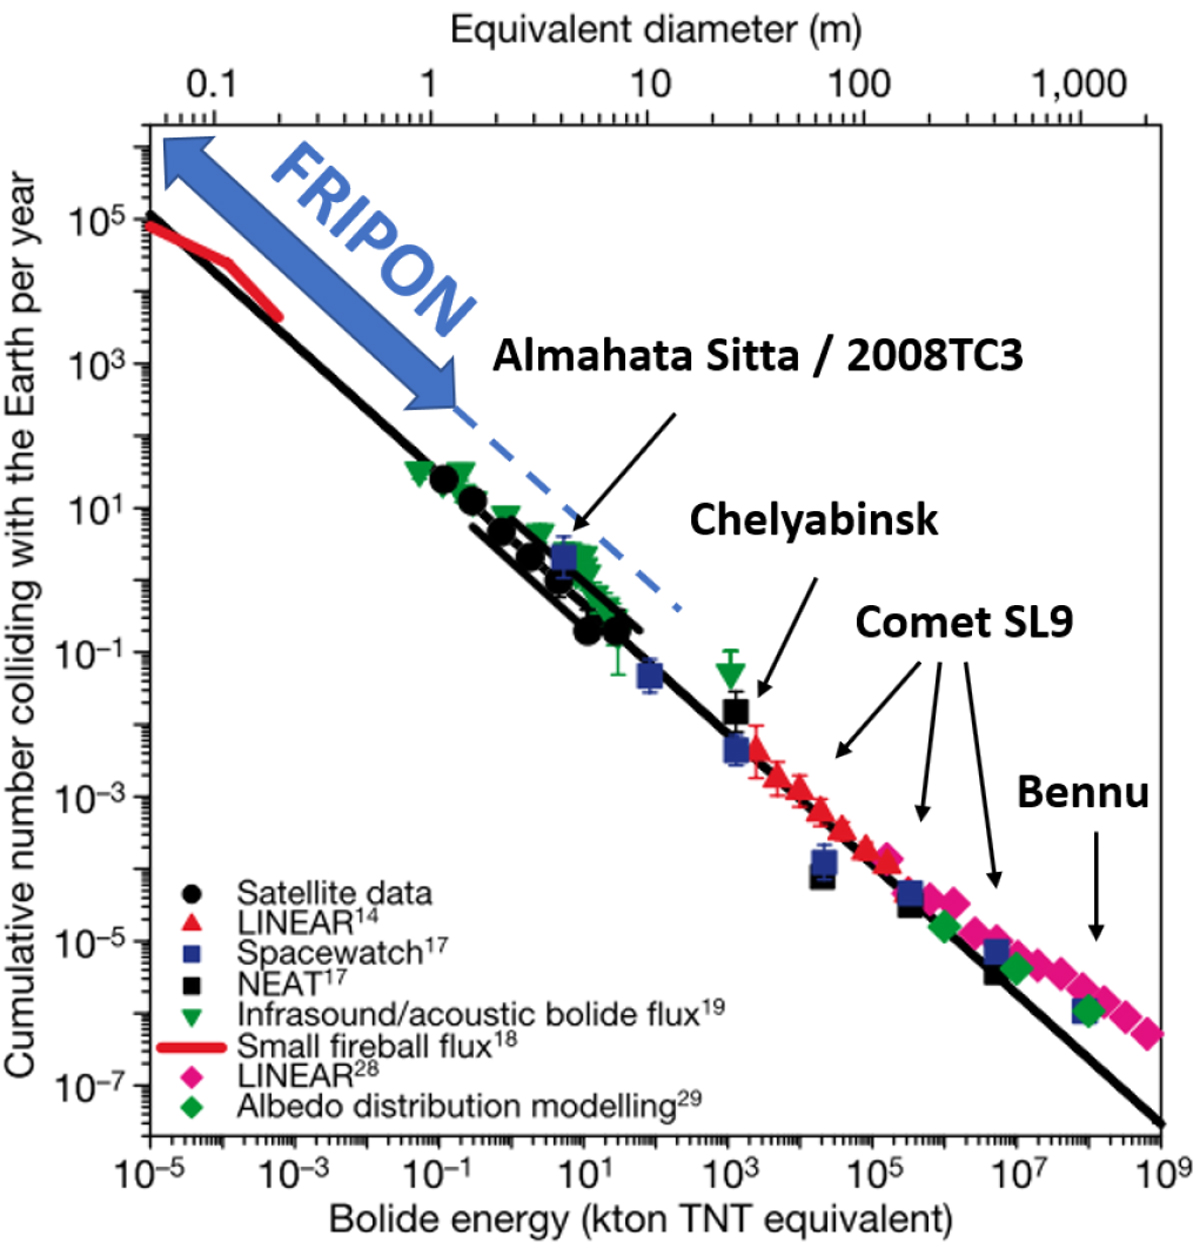 |
Figure 11 -
Flux of small near-Earth objects colliding with the Earth (Brown et al. 2002). Data are shown over a range of 14
magnitudes in energy. The statistical model is based on near-Earth population for big sizes and, for the smaller objects,
it is derived from a decade-long survey of ground-based observations of meteor and fireballs. The FRIPON network
lies exactly between minor planets (detected by telescopes and planetary impacts) and interplanetary dust (detected
by meteor networks). The solid arrow corresponds to FRIPON nominal mode; the dashed line is for rare events,
observable by FRIPONbut with a very low probability.
|
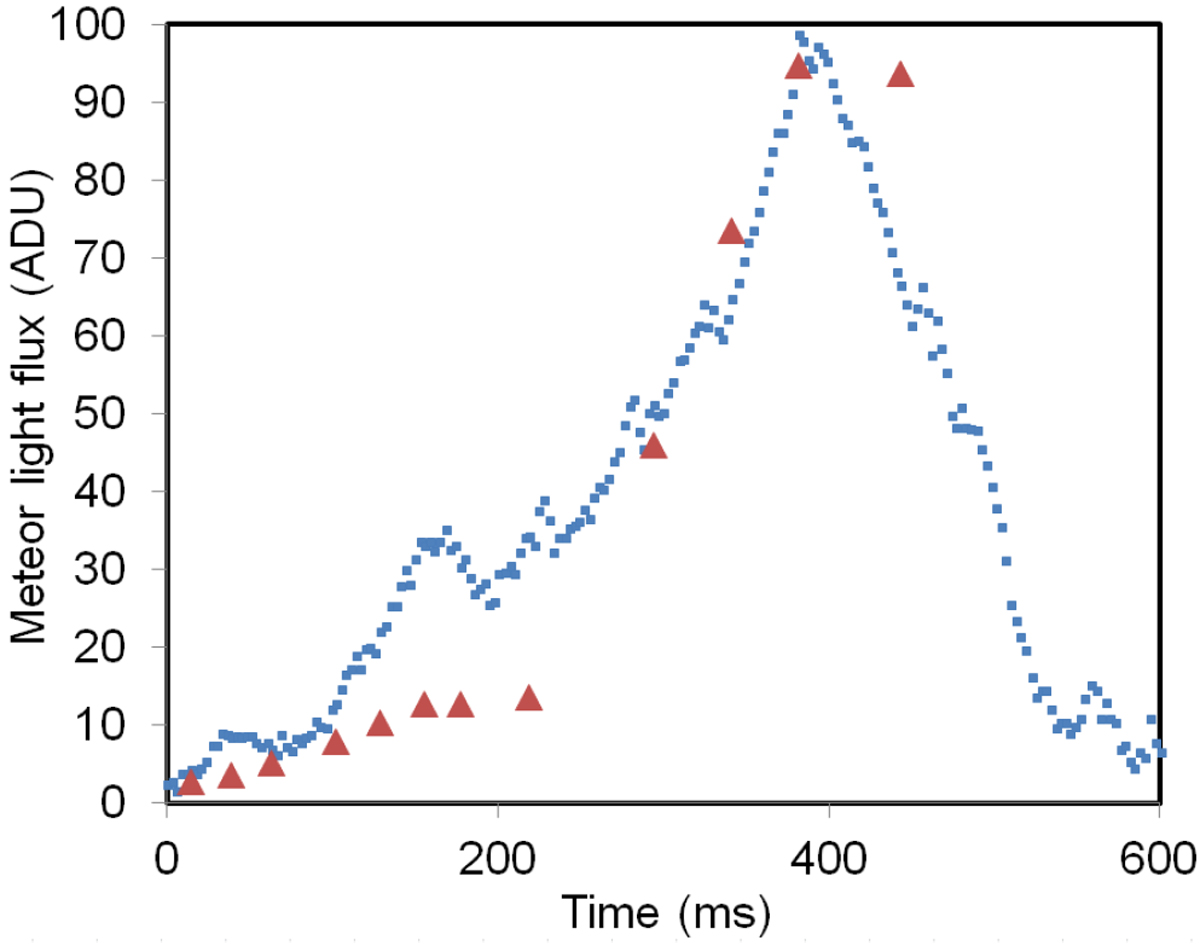 |
Figure 12 -
Raw light flux from a bolide observed on 14 August 2019 at 03h07m02s UTC. Red triangles: Dijon FRIPON camera data
(30 Hz, 12 bits).
Blue squares: radiometer prototype data (20 kHz, 14 bits). The faster acquisition rate and the higher amplitude dynamic range of
the radiometer allows more detailed observations of the meteor fragmentation and of high speed luminosity variations.
|
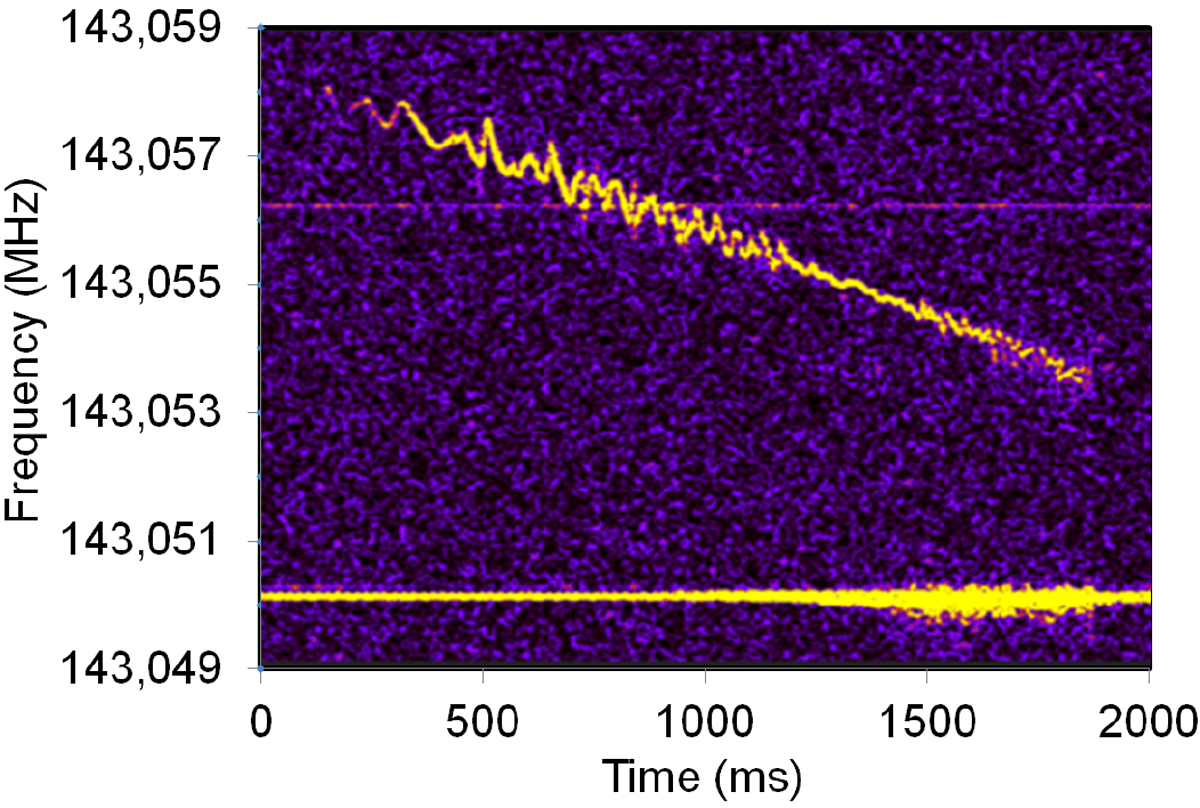 |
Figure 13 -
Cyclic Doppler fluctuations on radio echo of the bolide observed on 8 August 2018 at 02h25m UTC, as seen by the Sutrieu radio
receiver. Initial speed was 25.8 km/s.
|
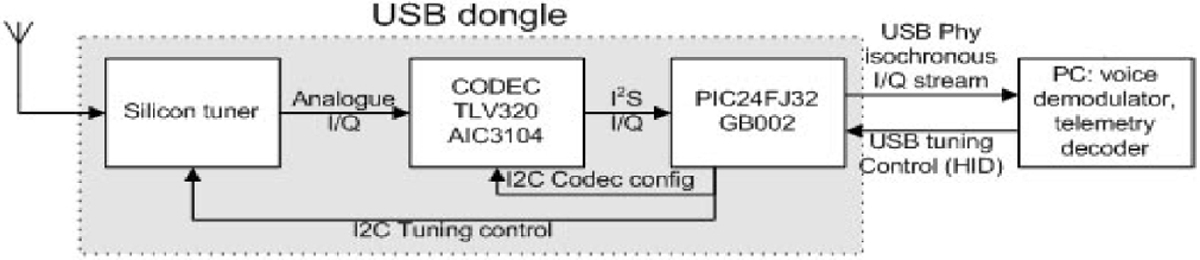 |
Figure B.1 -
Diagram of the FUNcube (Abbey 2013) Software Defined Radio.
|
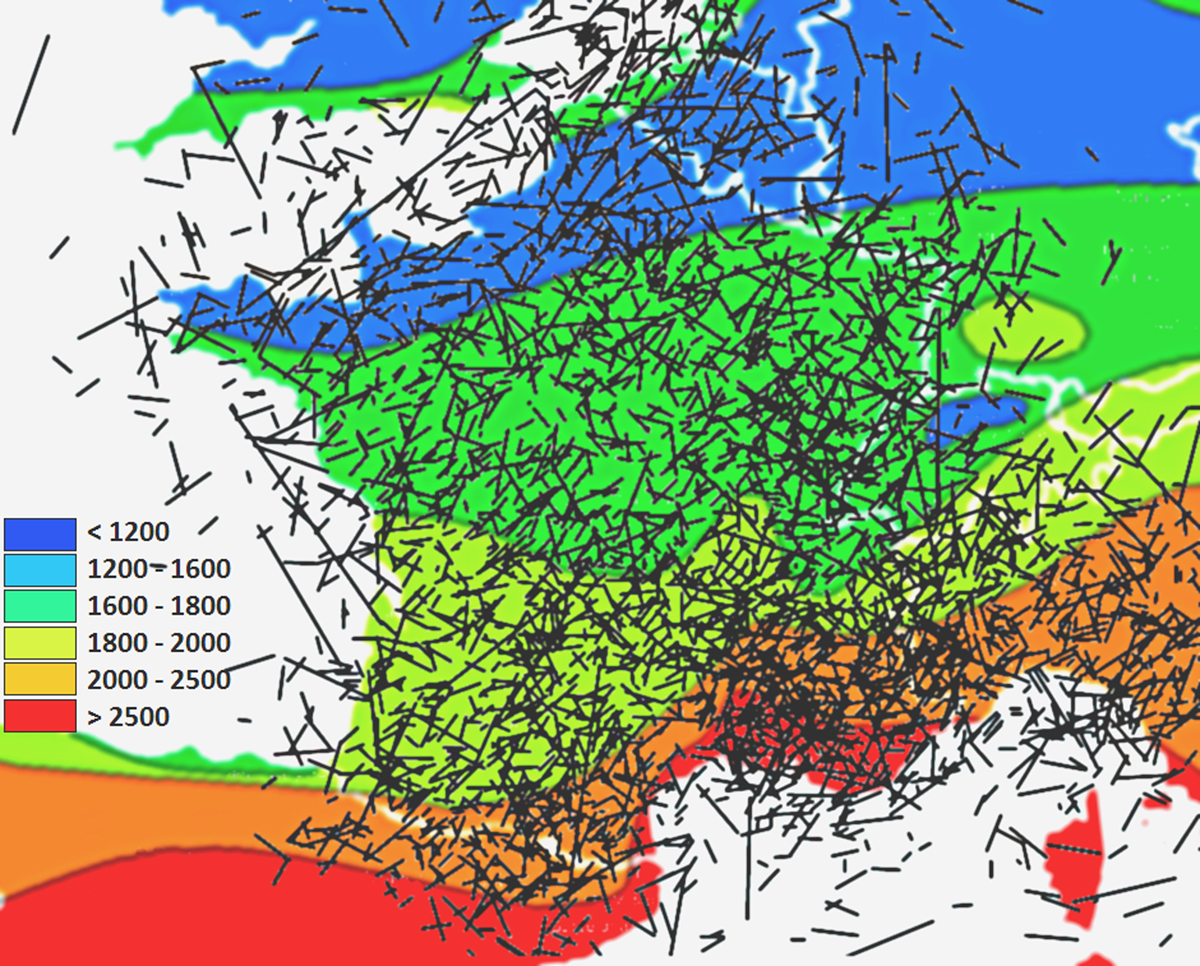 |
Figure C1 -
Map of the 3700 trajectories measured with FRIPON data from 2016 to early 2020. The concentration of detections
is in part explained by the background sunshine weather map (sunshine duration in hours per year). The Rhône valley and
the south of France have twice as many clear nights as the north. Another factor is that the installation of the cameras,
done mostly throughout 2016, started in southern France and around Paris.
|
Back to article listing |
|
Shortcut to Space Stuff |
| AB/May 2021 |
|
|