Back to article listing

Back to article listing |
|
Shortcut to Space Stuff |
| Fulle, M., Lazzarin, M., La Forgia, F., Zakharov, V. V., Bertini, I., Mazzotta Epifani, E., Ammannito, E., Buzzoni, A., Capria, M. T., Carbognani, A., Da Deppo, V., Della Corte, V., Fiscale, S., Frattin, E., Inno, L., Migliorini, A., Pernechele, C., Rotundi, A., Sindoni, G., Tubiana, C., Milani, G., Aletti, A., Bacci, P., Baj, G., Bellini, F., Bryssinck, E., Di Grazia, M., Facchini, M., Feraco, M., Guido, E., Ligustri, R., Kugel, F., Maestripieri, M., Tirelli, D., Valvasori, A., Snodgrass, C. & Jones, G. H.: |
| "Comets beyond 4 au: How pristine are Oort nuclei?" 2022, Monthly Notices of the Royal Astronomical Society, 513, 5377 |
|
|
Summary:
The ESA mission Comet Interceptor will target an Oort or interstellar comet during its first
approach to the Sun. Meanwhile, the Vera Rubin LSST Survey will observe hundreds of active comets
per month beyond 4 au from the Sun, where water vapour pressure is expected to be too low to
eject dust. We discuss observations of dust tails at heliocentric distances larger than 4 au in
order to retrieve the physical parameters driving cometary activity beyond Jupiter by means of a
probabilistic tail model, which is consistent with the activity model defining the gas coma
parameters due to the sublimation of carbon monoxide, molecular oxygen, methane, ethane, and carbon
dioxide since the activity onset at 85 au from the Sun. We find that: (i) All the observed dust
tails are consistent with the adopted activity model; (ii) The tail fits depend on three free
parameters only, all correlated to the nucleus size; (iii) Tail fits are always improved by
anisotropic dust ejection, suggesting activity of Oort nuclei dominated by seasons; (iv) Inbound
seasons suggest cometary activity before the ejection of protocomets into the Oort cloud, as
predicted by the activity model; (v) Oort nuclei larger than 1 km may be characterized by a
fallout up to ∼100 m thick deposited during ∼60 yr inbound; (vi) On the other side, Oort nuclei
smaller than 1 km may appear more pristine than Jupiter Family Comets when observed at 1 au from the Sun.
|
|
Enhanced HTML/PDF version at the MNRAS site (*) (*) May require access password |
Local link to the PDF version (1.4 Mb)
(For personal use only) |
|
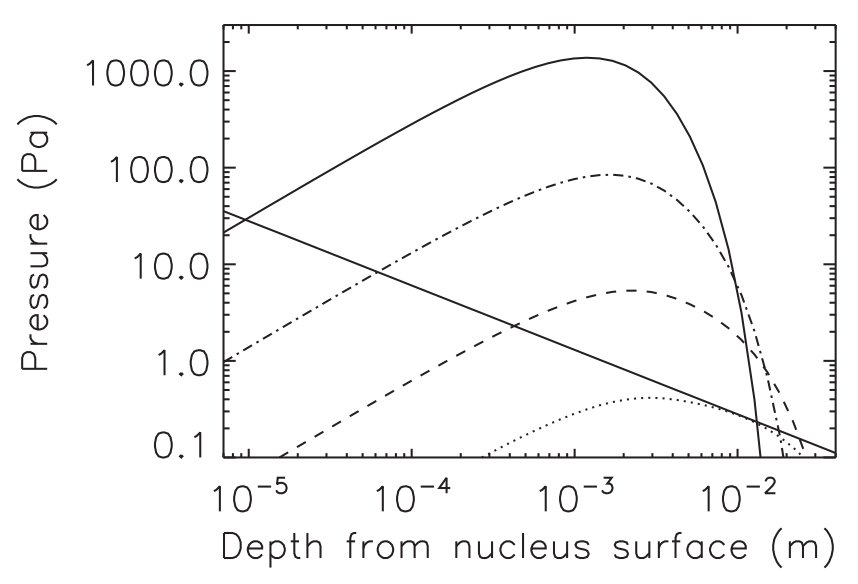
Figure 1 -
Pressure P of CO2 gas inside the pebbles versus the depth s.
Continuous straight line: tensile strength, S, bonding a dust homogeneous
aggregate of size s (Skorov & Blum 2012). Continuous curved line: P at Ts =
160 K and ∇T = 39 K cm-1 crosses S at sm = 9 μm and
sM = 12 mm,
where
sm and sM are the minimum and maximum sizes of the ejected dust. Dot and
dashed line: P at Ts = 139 K and ∇T = 17 K cm-1 crosses S at
sm = 60 μm and sM = 2 cm. Dashed line: P at Ts = 123 K and
∇T = 7 K cm-1 crosses S at sm = 0.4 mm and sM = 25 mm.
Dotted line: the curve P at Ts = 111 K and ∇T = 2 K cm-1 is tangent to the
line S at sm = sM = 1 cm
|

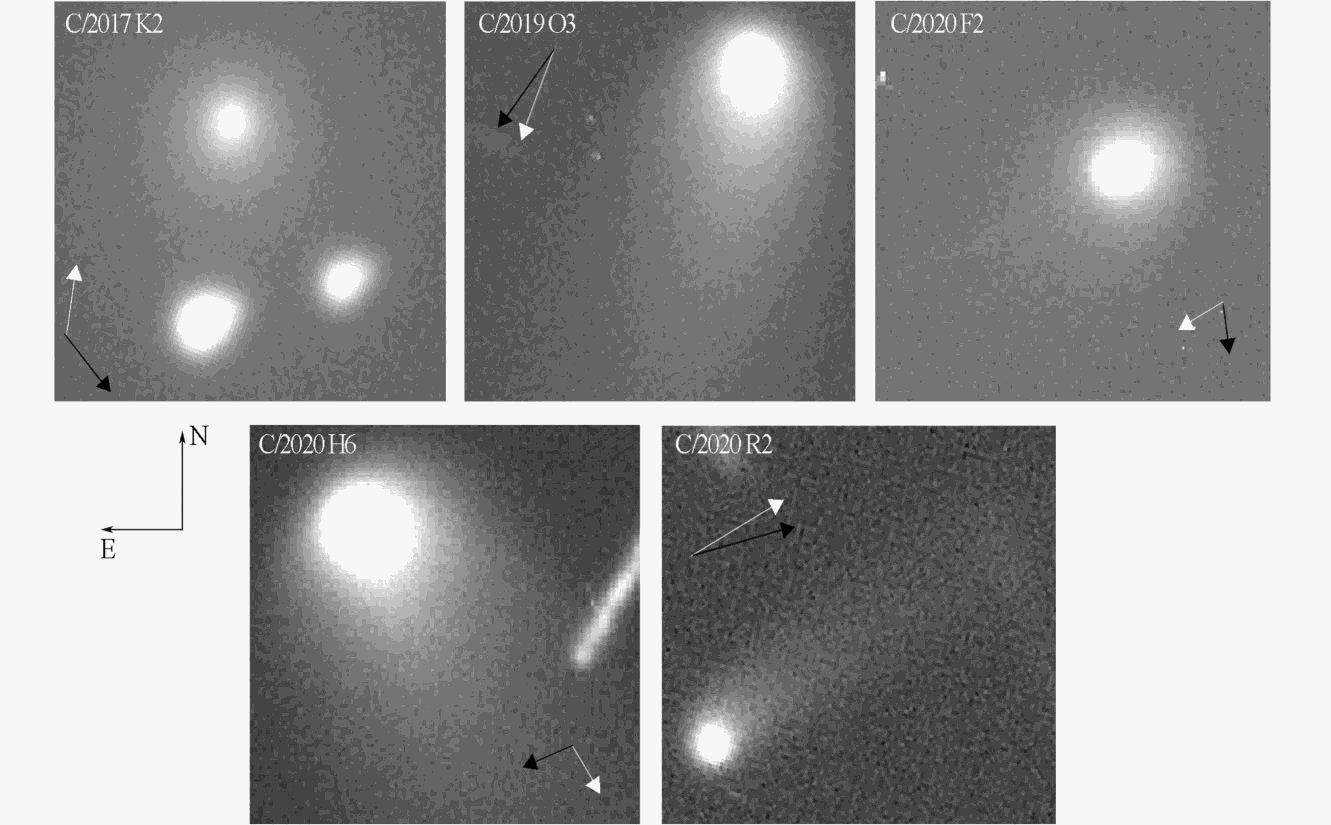
| Figure 2 -
Images of the dust tails summarized in Table 3. Each image covers a field of view of
25".2 × 25".2. Black arrow: antisolar direction. White arrow: Trailing orbit direction
|
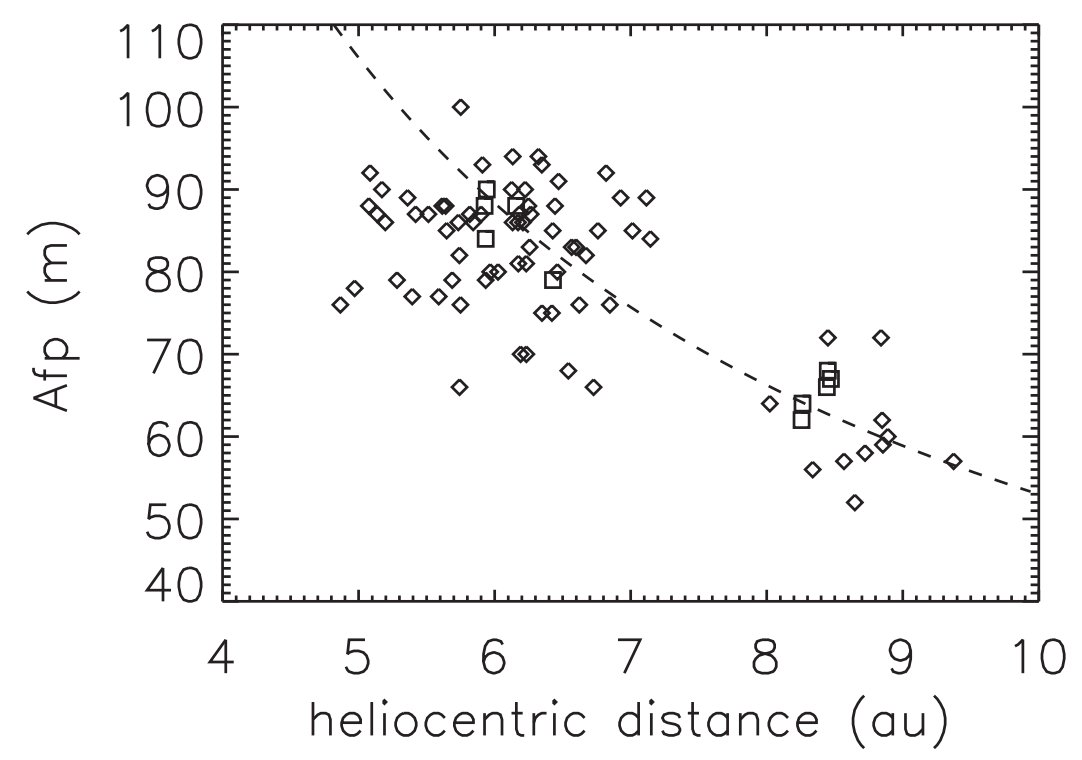 |
Figure 3 -
Afρ of comet C/2017K2 versus the heliocentric distance rh
measured within a sky-projected coma radius ρ0 = 5×10⁴ km. Diamonds:
observations of the CARA network. Squares: observations at Loiano Observatory. Dashed line: best fit of Loianos data constrained by the dust tail
model (Table 5).
|
|
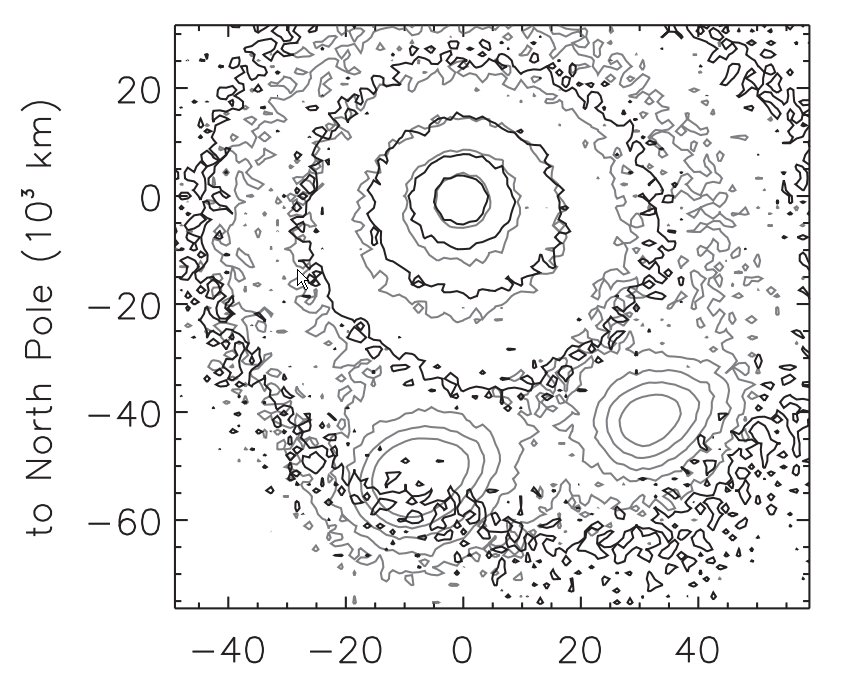
Figure 4 -
Isophotes of the observed (grey isophotes) and of the model (black
isophotes) dust tail of comet C/2017K2 at rh = 6.35 au. The North direction is
up, and the East direction to the left. The brightness step between isophotes is
a factor two. The tail model assumes isotropic dust ejection from the nucleus,
provides d = 0.175 and is larger than observations on the western side.
|
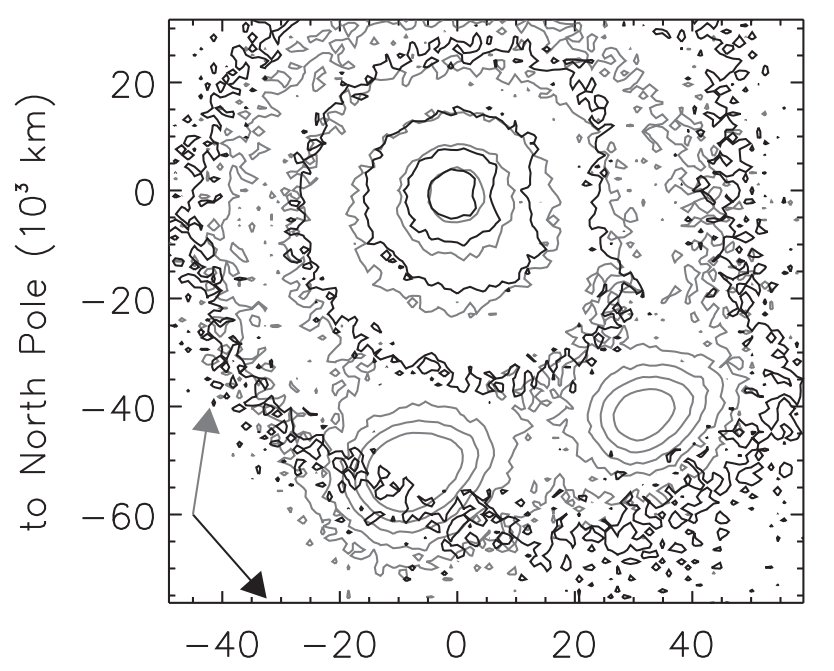 |
Figure 5 -
Isophotes of the observed (grey isophotes) and of the model (black
isophotes) dust tail of comet C/2017K2 at rh = 6.35 au. Black arrow: antisolar
direction. Grey arrow: trailing orbit direction. The tail model assumes no dust
ejection from nucleus latitudes <-60 deg, with a lower d = 0.165.
|
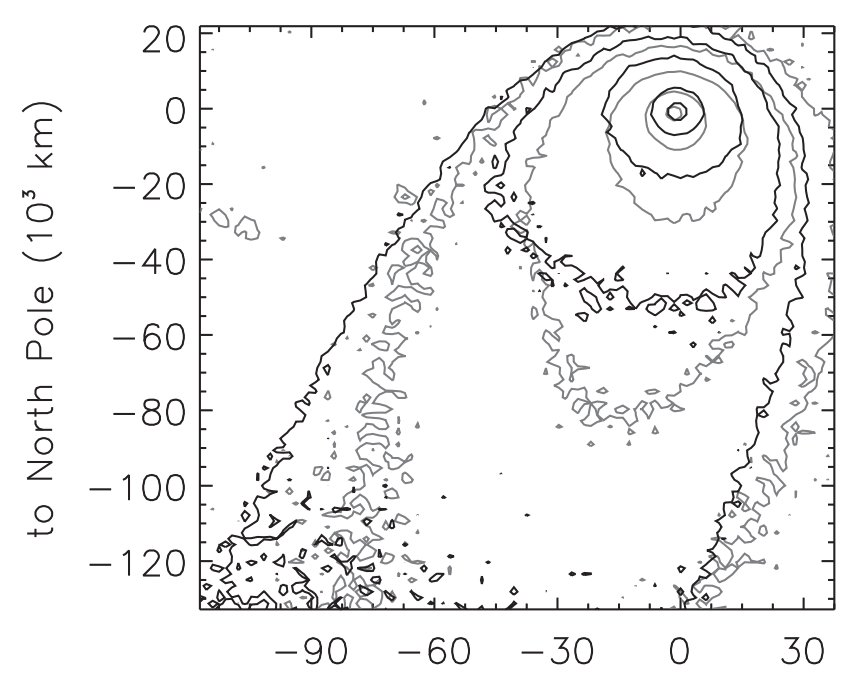 |
Figure 6 -
Isophotes of the observed (grey isophotes) and of the model (black
isophotes) dust tail of comet C/2019O3 at rh = 8.86 au. The North direction
is up, and the East direction to the left. The brightness step between isophotes
is a factor three. The tail model assumes isotropic dust ejection from the
nucleus, provides d = 0.108 and is larger than observations on the eastern
side.
|
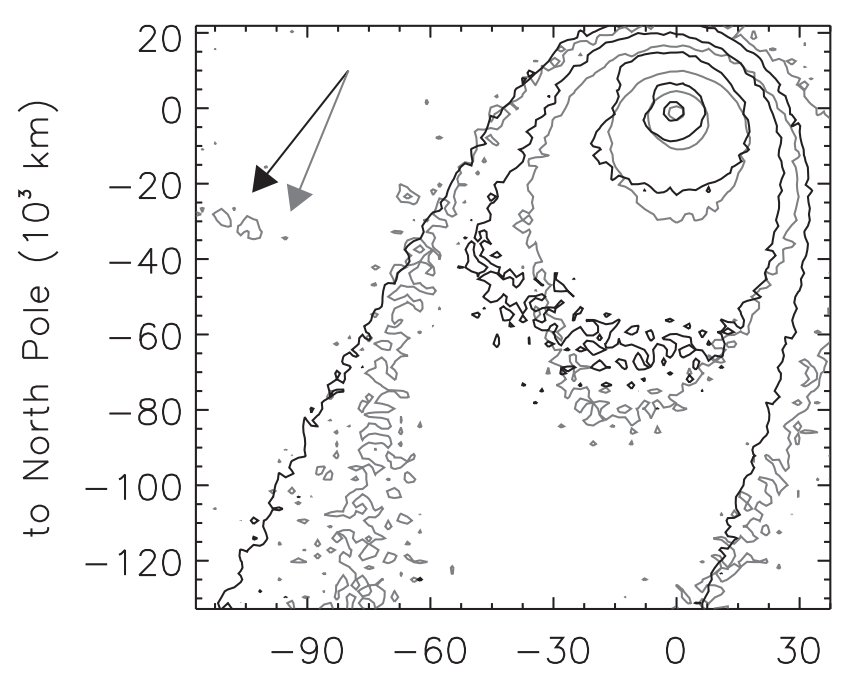 |
Figure 7 -
Isophotes of the observed (grey isophotes) and of the model (black
isophotes) dust tail of comet C/2019O3 at rh = 8.86 au. Black arrow: antisolar
direction. Grey arrow: trailing orbit direction. The tail model assumes no dust
ejection from nucleus latitudes <-60 deg, with a lower d = 0.081.
|
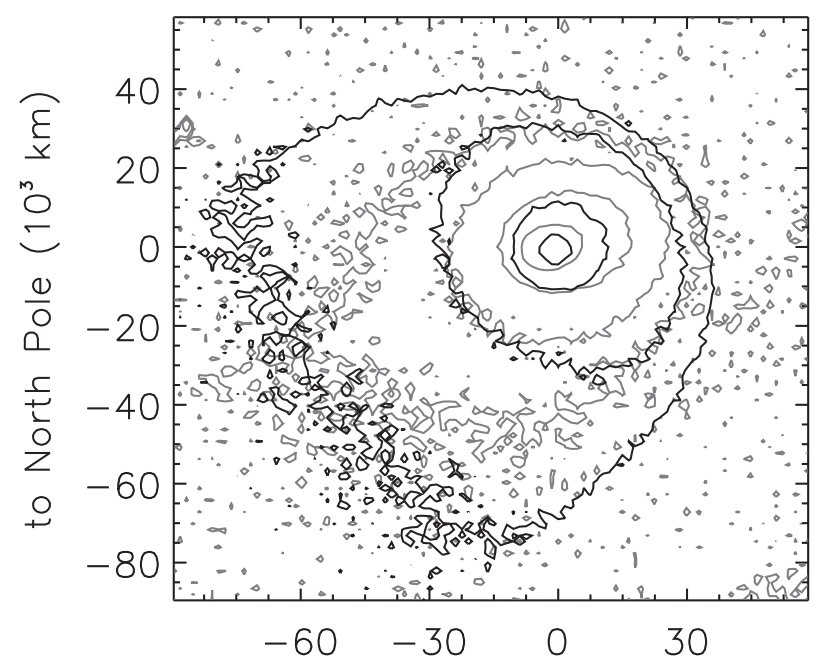 |
Figure 8 -
Isophotes of the observed (grey isophotes) and of the model (black
isophotes) dust tail of comet C/2020F2 at rh = 9.17 au. The North direction
is up, and the East direction to the left. The brightness step between isophotes
is a factor three. The tail model assumes isotropic dust ejection, provides
d = 0.148 and is larger than observations on the northern and southern
sides.
|
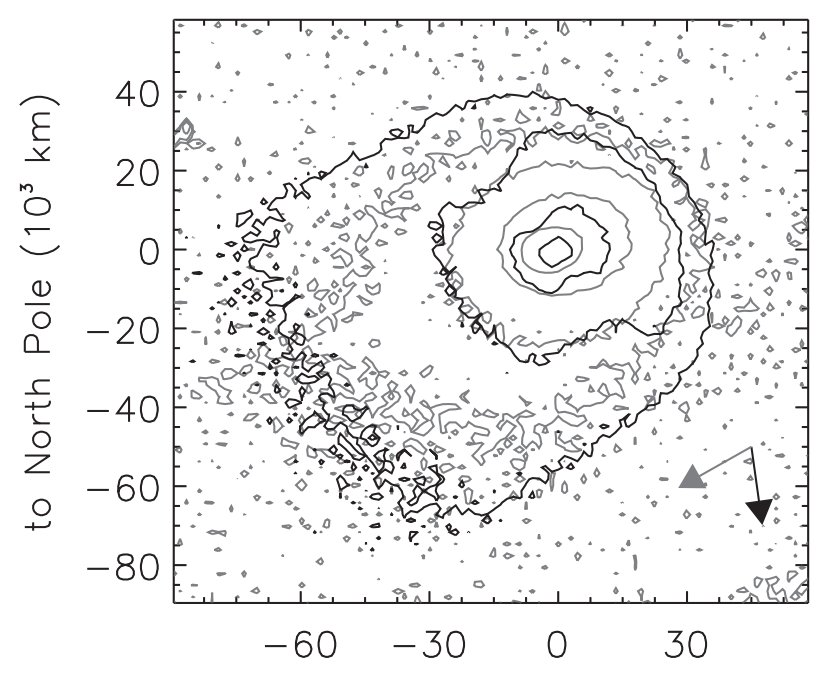 |
Figure 9 -
Isophotes of the observed (grey isophotes) and of the model (black
isophotes) dust tail of comet C/2020F2 at rh = 9.17 au. Black arrow: antisolar
direction. Grey arrow: trailing orbit direction. The tail model assumes no dust
ejection from nucleus latitudes <-60 and >+60 deg, with a lower d = 0.122
|
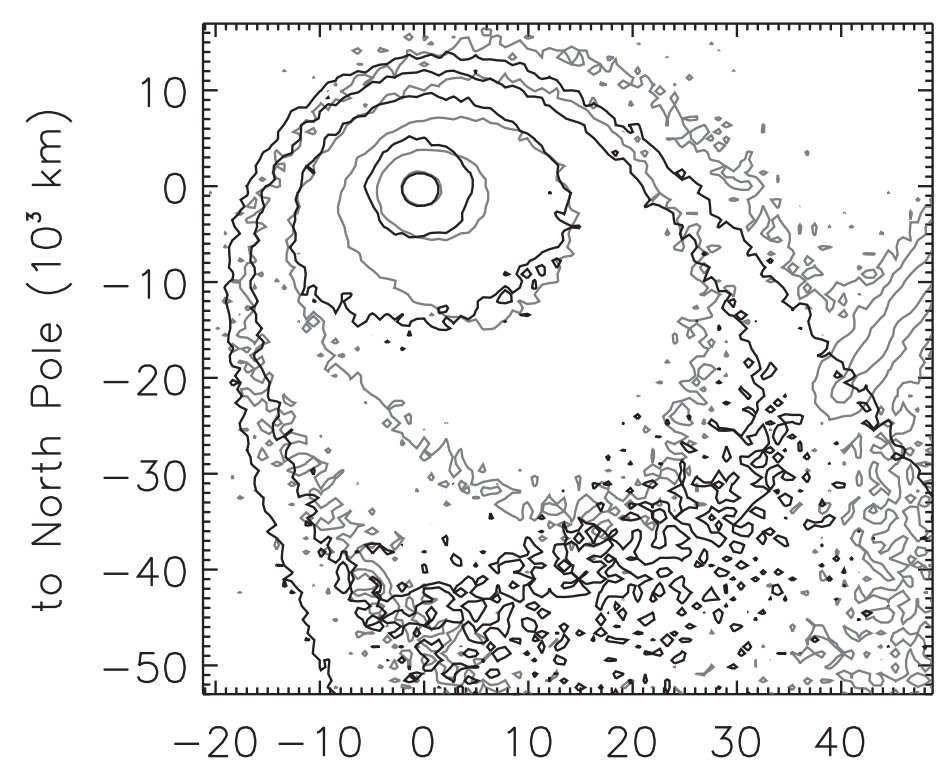 |
Figure 10 -
Isophotes of the observed (grey isophotes) and of the model
(black isophotes) dust tail of comet C/2020H6 at rh = 4.84 au. The North
direction is up, and the East direction to the left. The brightness step between
isophotes is a factor three. The tail model assumes isotropic dust ejection
from the nucleus, provides d = 0.143 and is larger than observations on the
eastern side.
|
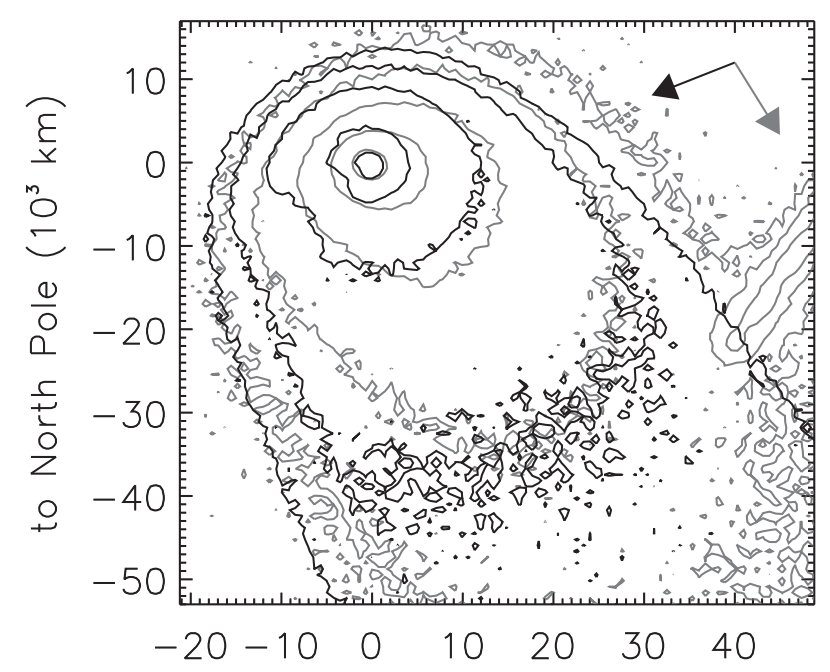 |
Figure 11 -
Isophotes of the observed (grey isophotes) and of the model (black
isophotes) dust tail of comet C/2020H6 at rh = 4.84 au. Black arrow: antisolar
direction. Grey arrow: trailing orbit direction. The tail model assumes no dust
ejection from nucleus latitudes <-60 deg, with a lower d = 0.115.
|
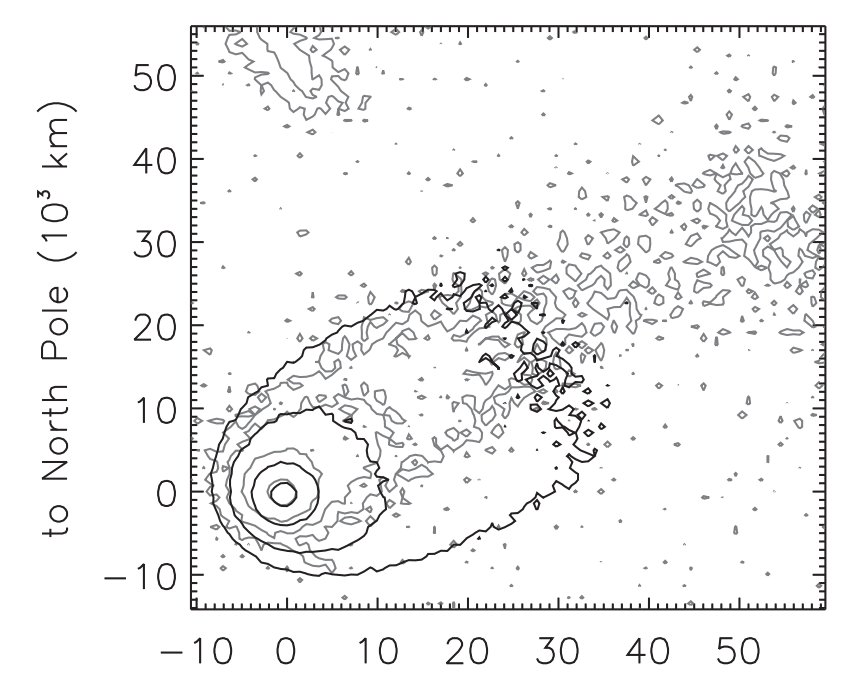 |
Figure 12 -
Isophotes of the observed (grey isophotes) and of the model
(black isophotes) dust tail of comet C/2020R2 at rh = 4.83 au. The North
direction is up, and the East direction to the left. The brightness step between
isophotes is a factor three. The tail model assumes isotropic dust ejection
from the nucleus, provides d = 0.073 and is larger than observations on the
southern side.
|
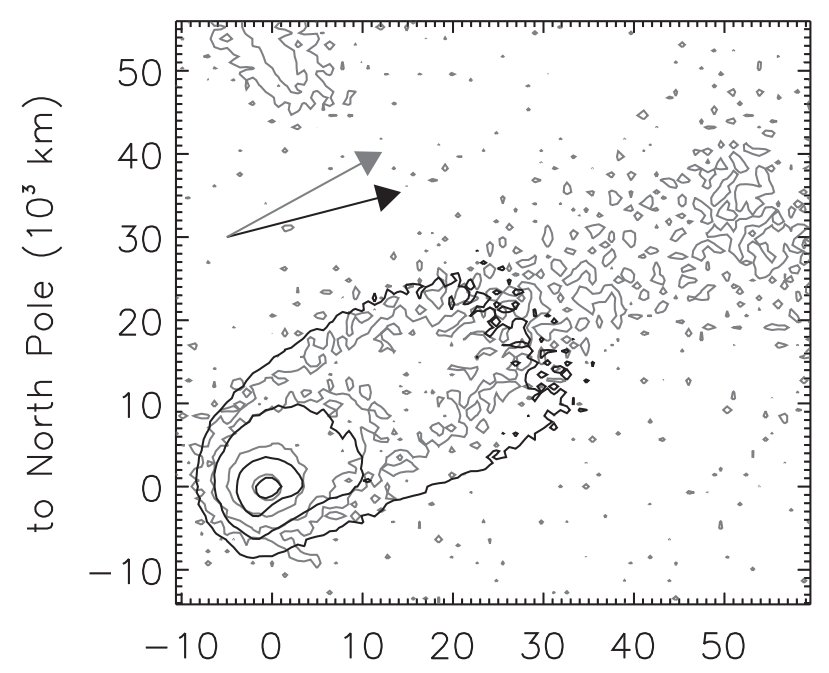 |
Figure 13 -
Isophotes of the observed (grey isophotes) and of the model (black
isophotes) dust tail of comet C/2020R2 at rh = 4.83 au. Black arrow: antisolar
direction. Grey arrow: trailing orbit direction. The tail model assumes no dust
ejection from nucleus latitudes <-40 deg, with a lower d = 0.057.
|
| Tables | |
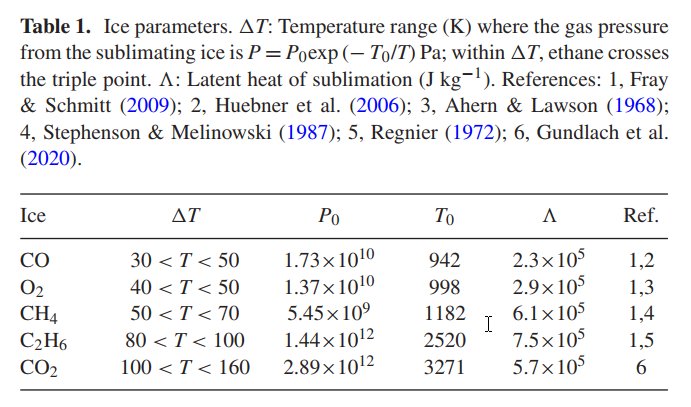 |
Table 1 -
Ice parameters. ΔT: Temperature range (K) where the gas pressure
from the sublimating ice is P = P0exp (- T0/T) Pa; within ΔT, ethane crosses
the triple point. Λ: Latent heat of sublimation (J kg-1). References: 1, Fray
& Schmitt (2009); 2, Huebner et al. (2006); 3, Ahern & Lawson (1968);
4, Stephenson & Melinowski (1987); 5, Regnier (1972); 6, Gundlach et al.
(2020).
|
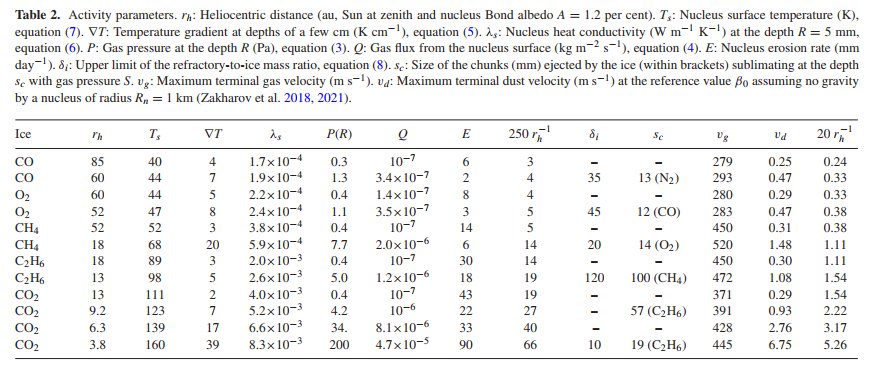 |
Table 2 -
Activity parameters. rh: Heliocentric distance (au, Sun at zenith and nucleus Bond albedo
A = 1.2 per cent). Ts: Nucleus surface temperature (K),
equation (7). ∇T: Temperature gradient at depths of a few cm (K cm-1), equation (5).
λs: Nucleus heat conductivity (W m-1 K-1) at the depth R = 5 mm,
equation (6). P: Gas pressure at the depth R (Pa), equation (3). Q: Gas flux from the nucleus surface
(kg m-2 s-1), equation (4). E: Nucleus erosion rate (mm day-1).
δi: Upper limit of the refractory-to-ice mass ratio, equation (8).
sc: Size of the chunks (mm) ejected by the ice (within brackets) sublimating at the depth
sc with gas pressure S. vg: Maximum terminal gas velocity (m s-1).
vd: Maximum terminal dust velocity (m s-1) at the reference value β0 assuming
no gravity by a nucleus of radius Rn = 1 km (Zakharov et al. 2018, 2021).
|
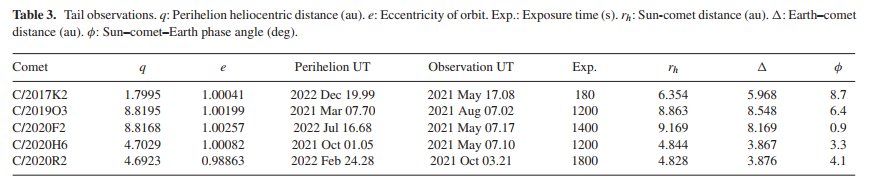 |
Table 3 -
Tail observations. q: Perihelion heliocentric distance (au). e: Eccentricity of orbit.
Exp.: Exposure time (s). rh: Sun-comet distance (au). Δ: Earthcomet
distance (au). f: SuncometEarth phase angle (deg)
|
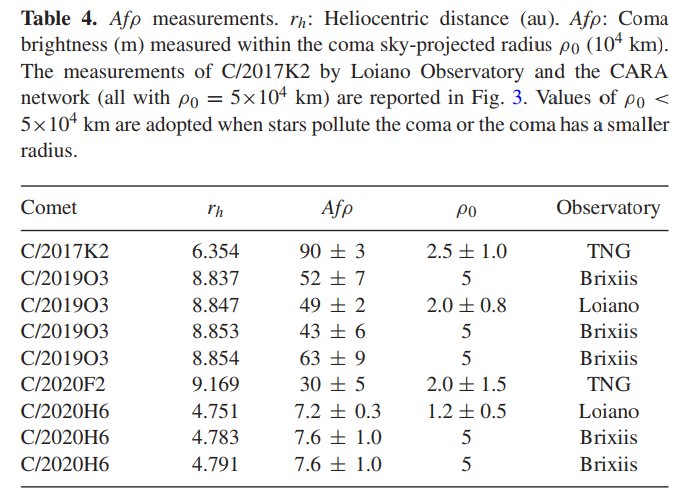 |
Table 4 -
Afρ measurements. rh: Heliocentric distance (au). Afρ: Coma
brightness (m) measured within the coma sky-projected radius ρ0 (104 km).
The measurements of C/2017K2 by Loiano Observatory and the CARA
network (all with ρ0 = 5×10⁴ km) are reported in Fig. 3. Values of
ρ0 < 5×10⁴ km are adopted when stars pollute the coma or the coma
has a smaller radius.
|
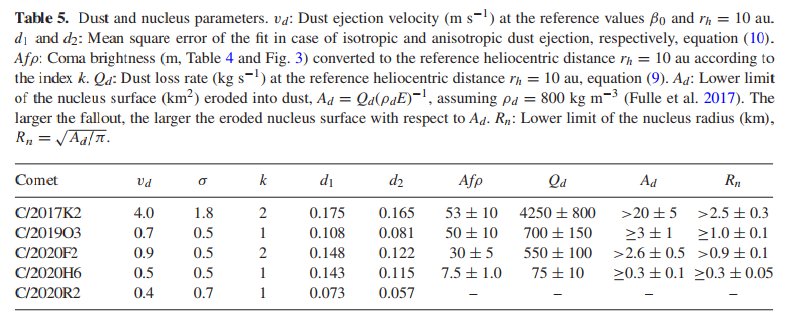 |
Table 5 -
Dust and nucleus parameters. vd: Dust ejection velocity (m s-1) at the reference
values β0 and rh = 10 au.
d1 and d2: Mean square error of the fit in case of isotropic and anisotropic dust
ejection, respectively, equation (10).
Afρ: Coma brightness (m, Table 4 and Fig. 3) converted to the reference heliocentric distance
rh = 10 au according to the index k. Qd: Dust loss rate (kg s-1) at the
reference heliocentric distance rh = 10 au, equation (9). Ad: Lower limit
of the nucleus surface (km2) eroded into dust, Ad = Qd(ρdE)-1,
assuming ρd = 800 kg m-3 (Fulle et al. 2017). The
larger the fallout, the larger the eroded nucleus surface with respect to Ad. Rn:
Lower limit of the nucleus radius (km), Rn = (Ad/π)1/2.
|
Back to article listing |
|
Shortcut to Space Stuff |
| AB/Apr 2023 |
|
|