Back to article listing

Back to article listing |
|
Shortcut to Space Stuff |
| Buzzoni, A., Carbognani, A., Di Luca, R., Diolaiti, E., Gualandi, R., Semola, A., Stirpe, G.M., Bonoli, F., Bruni, I., Cortecchia, F., Foppiani, I., Galleti, S., Lombini, M., & Schreiber, L.: |
| "The TANDEM Project as a pilot case for wide-field telescope arrays", 2025, The Astronomical Journal, 169, 53 (DOI: 10.3847/1538-3881/ad93a2) |
|
|
Summary:
We give here an account of the TANDEM project (aka a Telescope Array eNabling
DEbris Monitoring), an innovative concept aimed at flanking, on a shared piggy-back
mount, the main G.D. Cassini 152 cm f/8 telescope at the INAF-OAS observing
premises in Loiano (Italy). The system is especially intended for Space Situational
Awareness (SSA) activities related to the study of asteroids and comets and on the
astrodynamical characterization of circum-terrestrial space debris and artificial satellites.
TANDEM consists of a combo of four customized and independently steereable
35 cm f/3 Newtonian telescopes, each equipped with a Moravian C4-16000 camera,
observing through the BVRcIc filters of the Johnson-Cousins system. The camera
carries onboard a GSense 4040 (4096 × 4096 px) monochrome CMOS with electronic
shutter and a 9 μm pixel size. A corrected field of view (FOV) of 2o × 2o is offered
by each telescope, though quite special pointing capabilities and observing modes
are available for the telescope array, such as to cover up to 16 deg2 across sparse
celestial fields, each up to 20o in separation. While especially conceived for observing
activities in the framework of the European Consortium for Space Surveillance and
Tracking (EU-SST), TANDEM may also find additional applications in a more direct
astronomical context, as we briefly outline along this review.
|
|
Enhanced HTML/PDF version at the Journal site (*) (*) Open access |
Local link to a PDF version (2.4 Mb) |
|
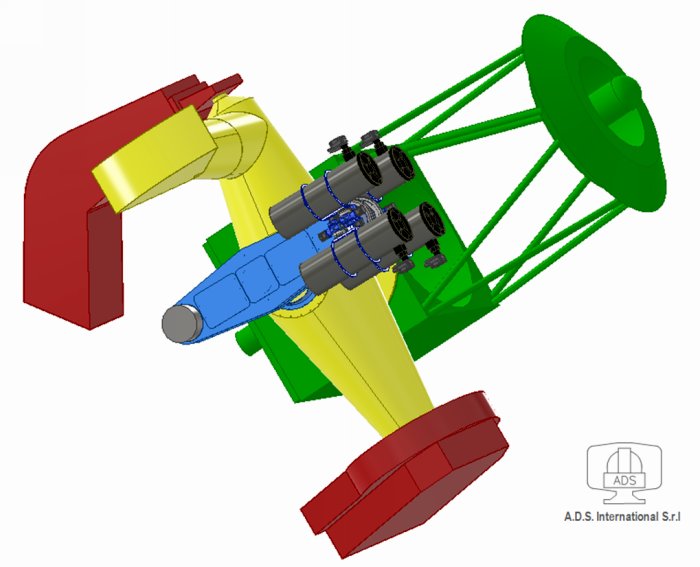
Figure 1 -
The ADS concept for TANDEM, as approved for final assembly on summer
2022. Note in the sketch the four telescopes (in black) mounted on a rotating arm (in blue)
anchored orthogonal to the Cassini (in green) polar axis (in yellow).
|

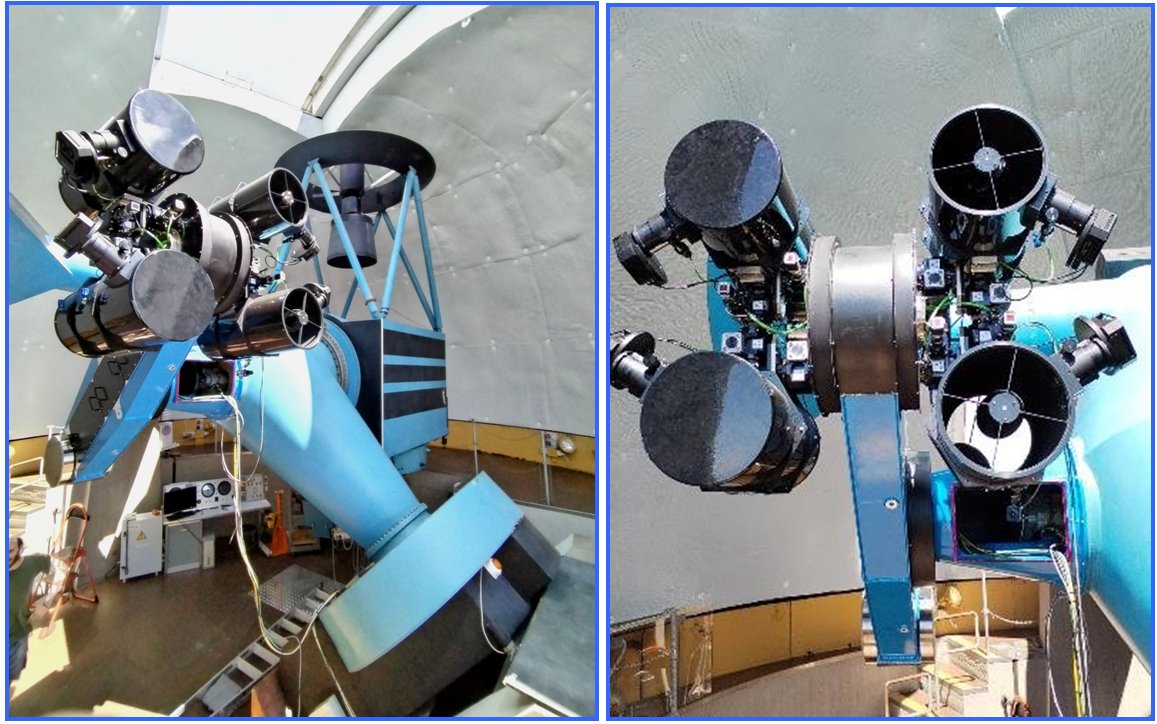
| Figure 2 -
Two views of the TANDEM telescope array, on top of its rotating arm, in a
piggy-back mounting at the declination axis flange of the Cassini main telescope (behind
in the left picture). TANDEM telescopes share Cassinis polar axis maneuvering, while
moving the combo independently in declination. In addition, each of the telescopes is
allowed a supplementary and independent steering by ± 10o around the common pointing
direction (both RA and Dec) by means of individual tilt/spin actuators onboard (visible in
the right picture).
|
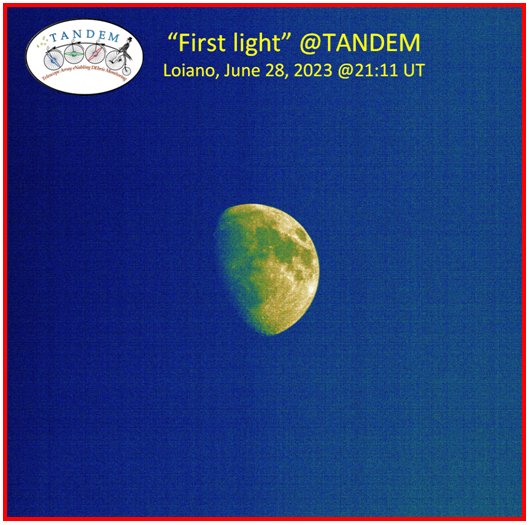 |
Figure 3 -
The first light of TANDEM, just after the preliminary focussing operations
on June 28, 2023. A spectacular B-band image of the waxing gibbous Moon, is taken with
the shortest exposure time allowed by the electronic shutter onboard the CMOS, namely
just 0.02 millisec.
|
|
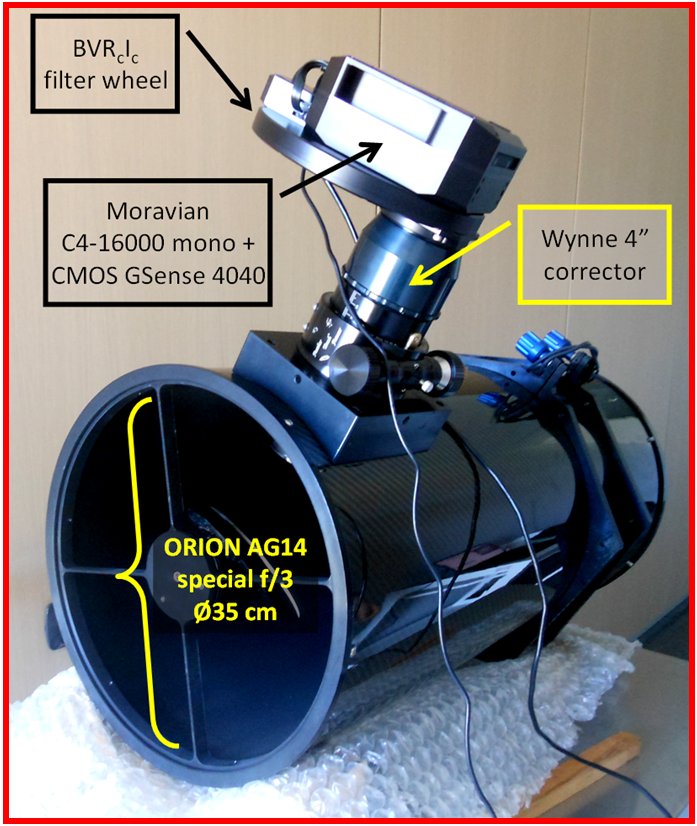
Figure 4 -
The optical design of TANDEM telescopes. Each instrument is a customized
ORION AG14 telescope with a 35 cm aperture diameter and Newtonian design, carried to
a focal ratio f/3 and coupled with an ad-hoc 4 Wynne field corrector. Imagery is provided
through a Moravian C4-16000 camera mounting a Johnson-Cousins BVRI filter wheel and
a CMOS GSense 4040 (4096 × 4096 px with 9μm pixel size).
|
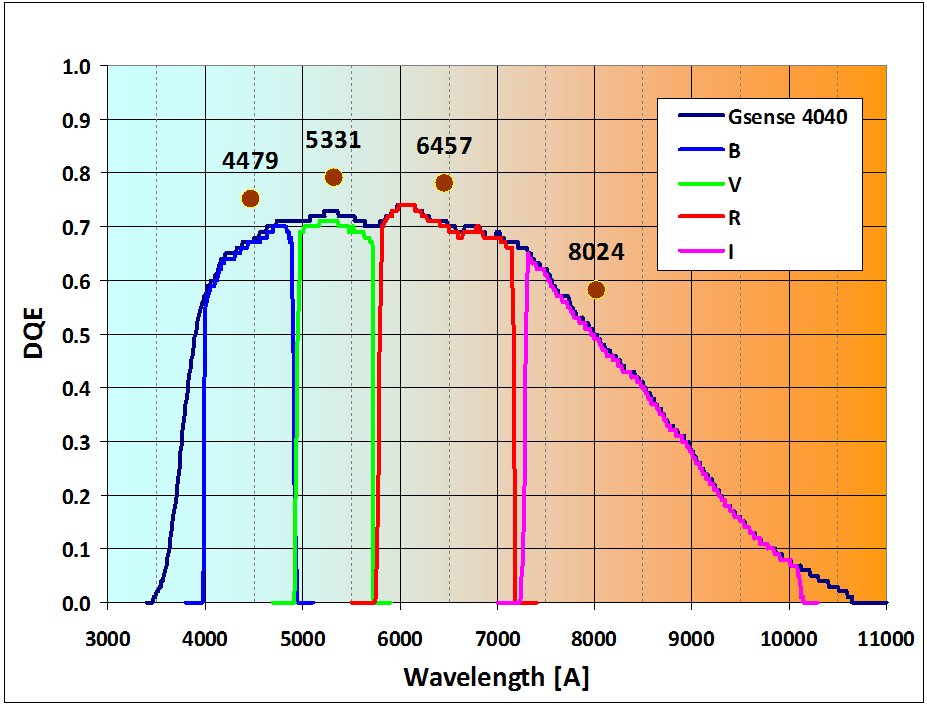 |
Figure 5 -
The TANDEM photometric system includes a set of four BVRcIc filters. Effective
wavelengths (dots and labels in the plot) fairly well reproduce the Johnson-Cousins system.
As a common feature, note that the Ic band is in fact mainly constrained by the CMOS
spectral transmission.
|
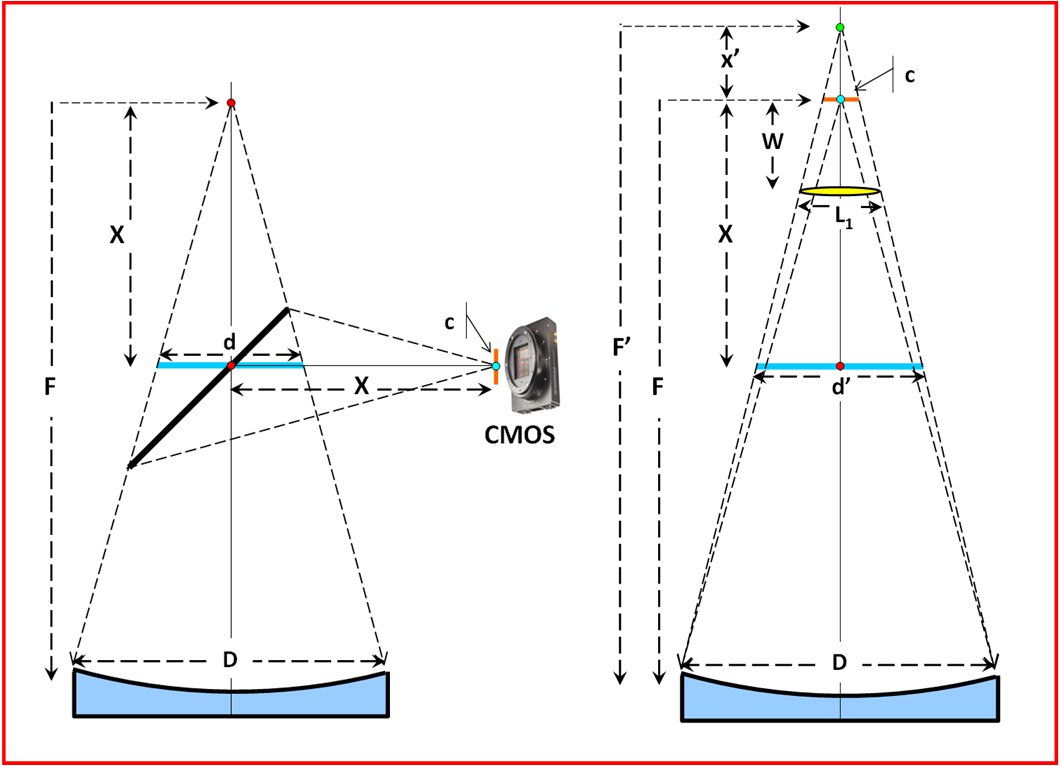 |
Figure 6 -
The illustrative sketch of the relevant parameters for TANDEMs optical design
optimization. See text for a full discussion.
|
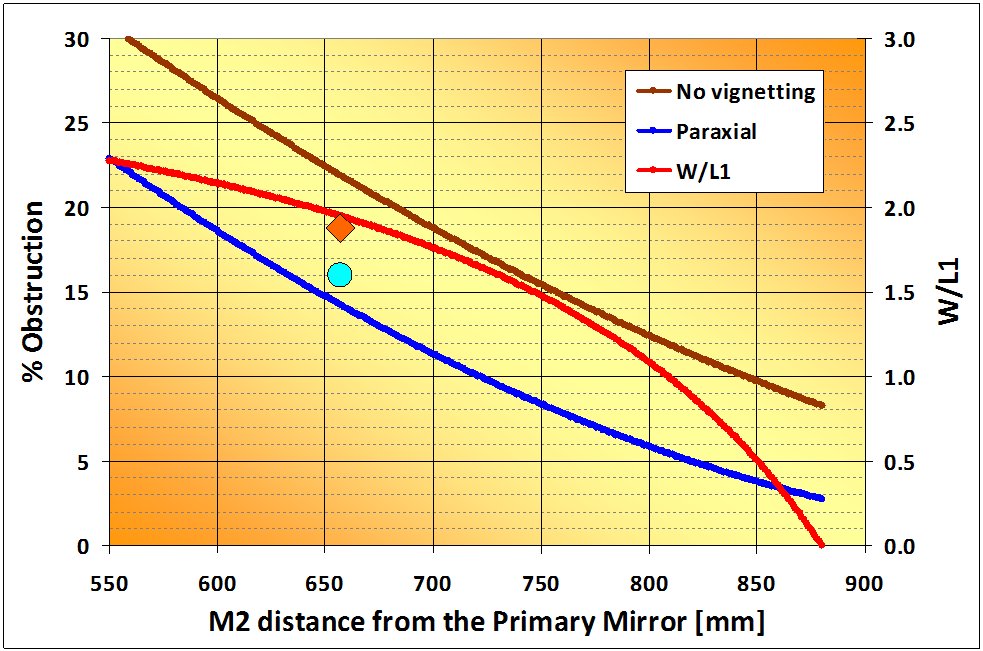 |
Figure 7 -
A diagnostic diagram for the optical design of TANDEM telescopes. The 16%
obstruction of the entrance pupil for the adopted size of the secondary mirror, placed at
a distance (F − X) = 657 mm from the primary mirror, is marked by the blue dot. It
is compared with the expected obstruction for a size of the secondary mirror such as to
intercept the paraxial optical beam only (blue curve) or the full FOV with no vignetting
(brown curve). The nominal ratio W/L1 for the Wynne corrector train is also displayed,
according to eq. (10) (red curve to refer to the right scale on the plot), compared with
the adopted figure for the telescopes (red diamond). The red curve has to be regarded as
an upper limit to optimum optical combinations. See text for a full discussion of these
quantities.
|
 |
Figure 8 -
The superposed TANDEM radial profile of vignetting, as directly assessed from
each of the four telescopes FOV. According to the adopted size of the secondary mirror we
have that the central 1o × 1o region of the frame is virtually unvignetted while a residual
effect up to some 0.15 mag appears at the 2o × 2o edge of the frame.
|
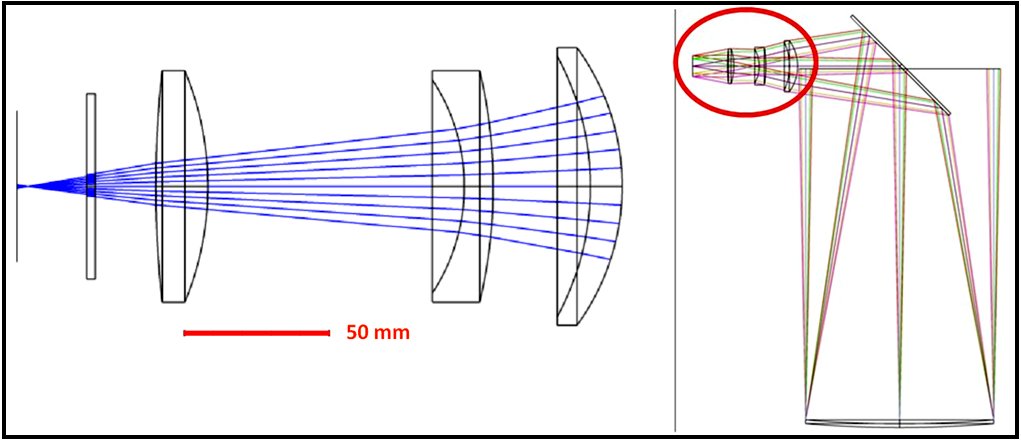 |
Figure 9 -
Left panel: The adopted optical design for the Wynne corrector onboard of the
TANDEM telescopes. The optical train is placed just in front of the CMOS detector (and
the filter wheel), and intercepts the incoming optical beam from the secondary mirror of
the Newtonian system, as sketched in the right panel.
|
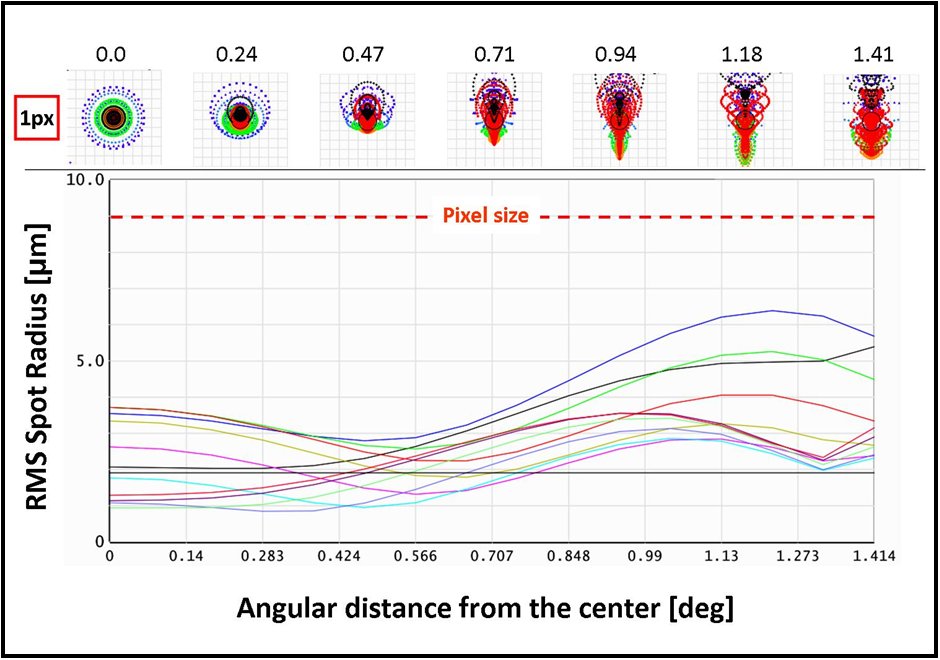 |
Figure 10 -
TANDEM telescopes image quality diagnostics, according to the Zemax OpticStudio modelling. The upper sequence displays
the multi-wavelength spot diagram at
increasing radial distance (in degrees) from the optical axis, as labelled above each spot.
Johnson-Cousins filters are color coded in the spots as B = blue, V = green, Rc = red,
and Ic = violet. The pixel size is reported top left, as a reference. The lower plot displays
the RMS spot radius (in µm) along the radial distance from the CMOS center for a set
of sampled wavelengths in the 4000-9000 Å wavelength range, as schematically color-coded
by the curves in the plot. The black curve refers to the polichromatic response, while the
horizontal line at 1.91 μm is the diffraction limit set by the Airy disk. The 9 μm pixel size
of the GSense 4040 CMOS is marked as a dashed red line, as labelled. The nominal figures
do not take into account seeing broadening and mechanical tolerance in the optical system
assembly.
|
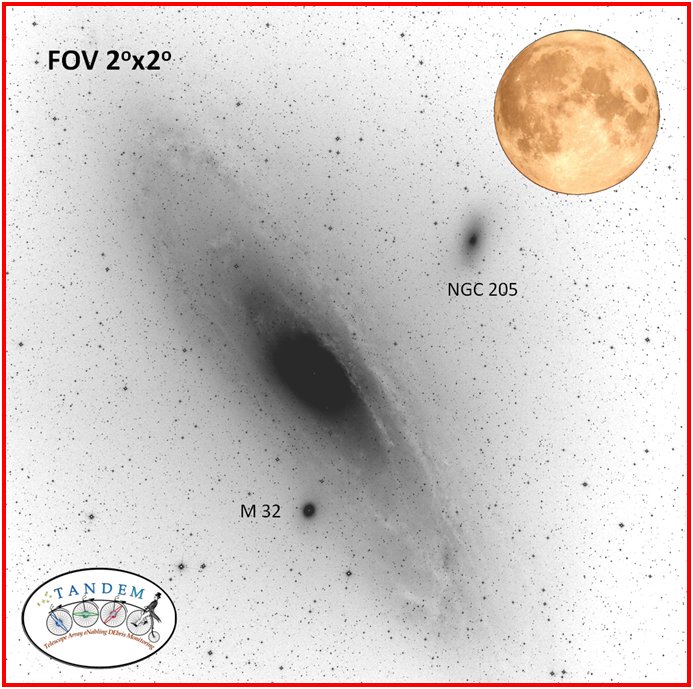 |
Figure 11 -
The covered FOV of TANDEM in collimated configuration, with the four
telescopes pointing the same 2o × 2o field. The celestial region around the Andromeda Galaxy
M31 is displayed as an illustrative reference, together with a Full Moon sketch. Though with
a smaller FOV, this configuration allows the observer to maximize TANDEM sensitivity,
reaching a 0.75 deeper magnitude limit compared to imaging with a single telescope.
|
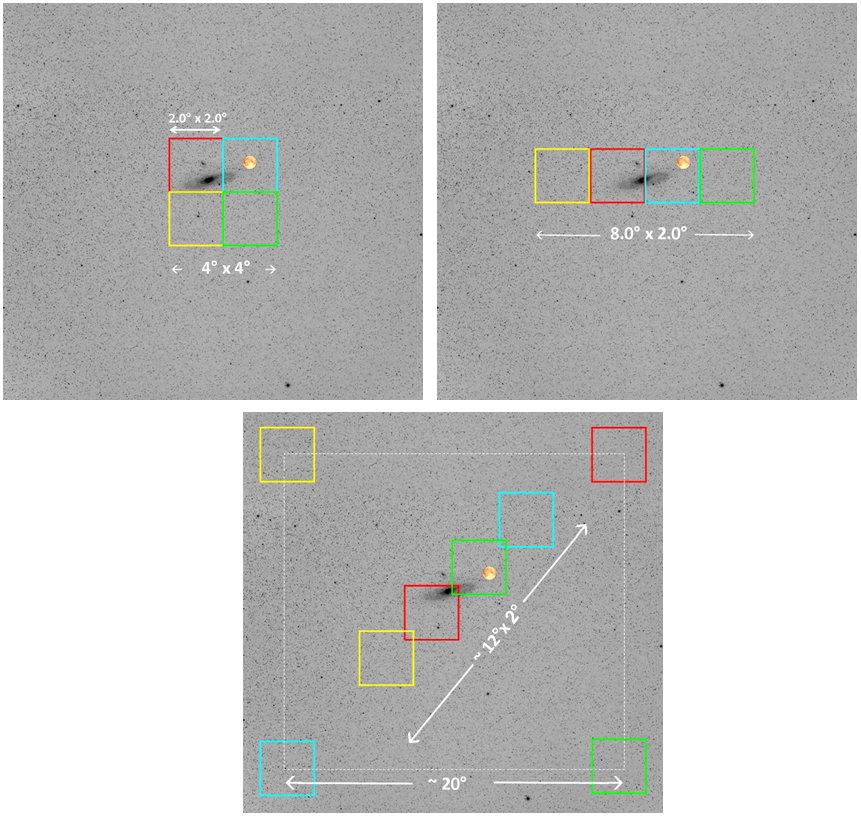 |
Figure 12 -
Some of the pre-defined pointing patterns for the four TANDEM telescopes
(each marked with a different colour). As a reference, the celestial region around the
Andromeda Galaxy M31 has been displayed, together with a Full Moon sketch. Note in
particular, in the lower panel, two very extended sparse-field options, one along a diagonal
direction spanning a 12o × 12o FOV and the other consisting of four independent pointings
each 20o apart.
|
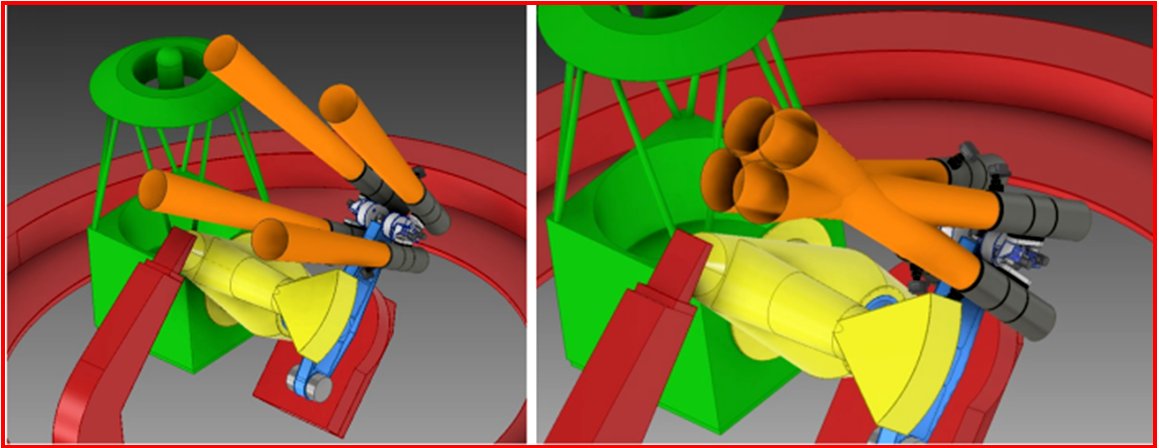 |
Figure 13 -
The same pointing is compared before (left) and after (right) TANDEM optimization. Note in the right panel that
the four telescopes are automatically re-assigned to each field such as to obtain a converging pointing pattern that
minimizes the cross section through the dome shutter.
|
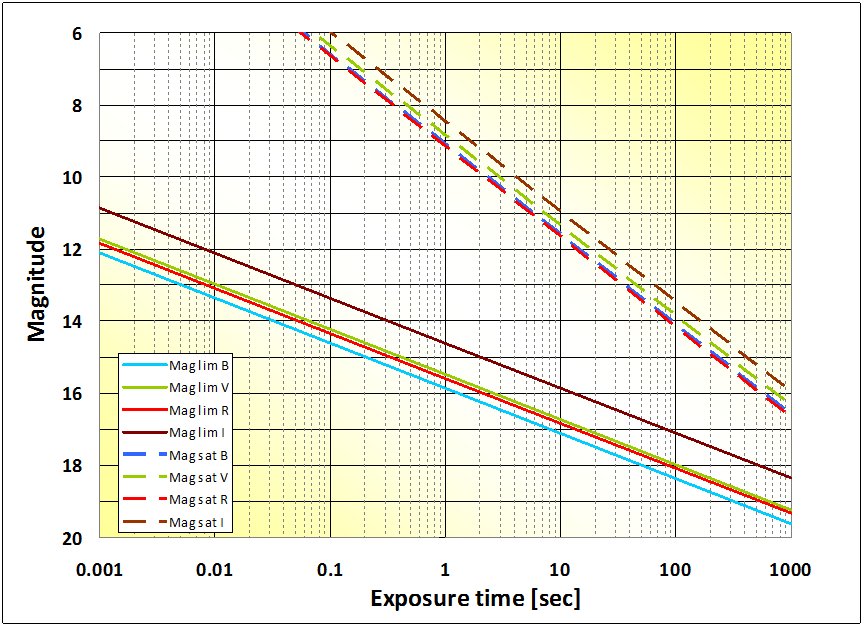 |
Figure 14 -
According to eq. (13), solid lines display the magnitude limit for a S/N = 3
detection threshold in the different photometric bands (as reported in the legend on the plot)
reached by each TANDEM telescope with increasing exposure time. The corresponding
saturation cap is also showed (dashed lines) according to eq. (12).
|
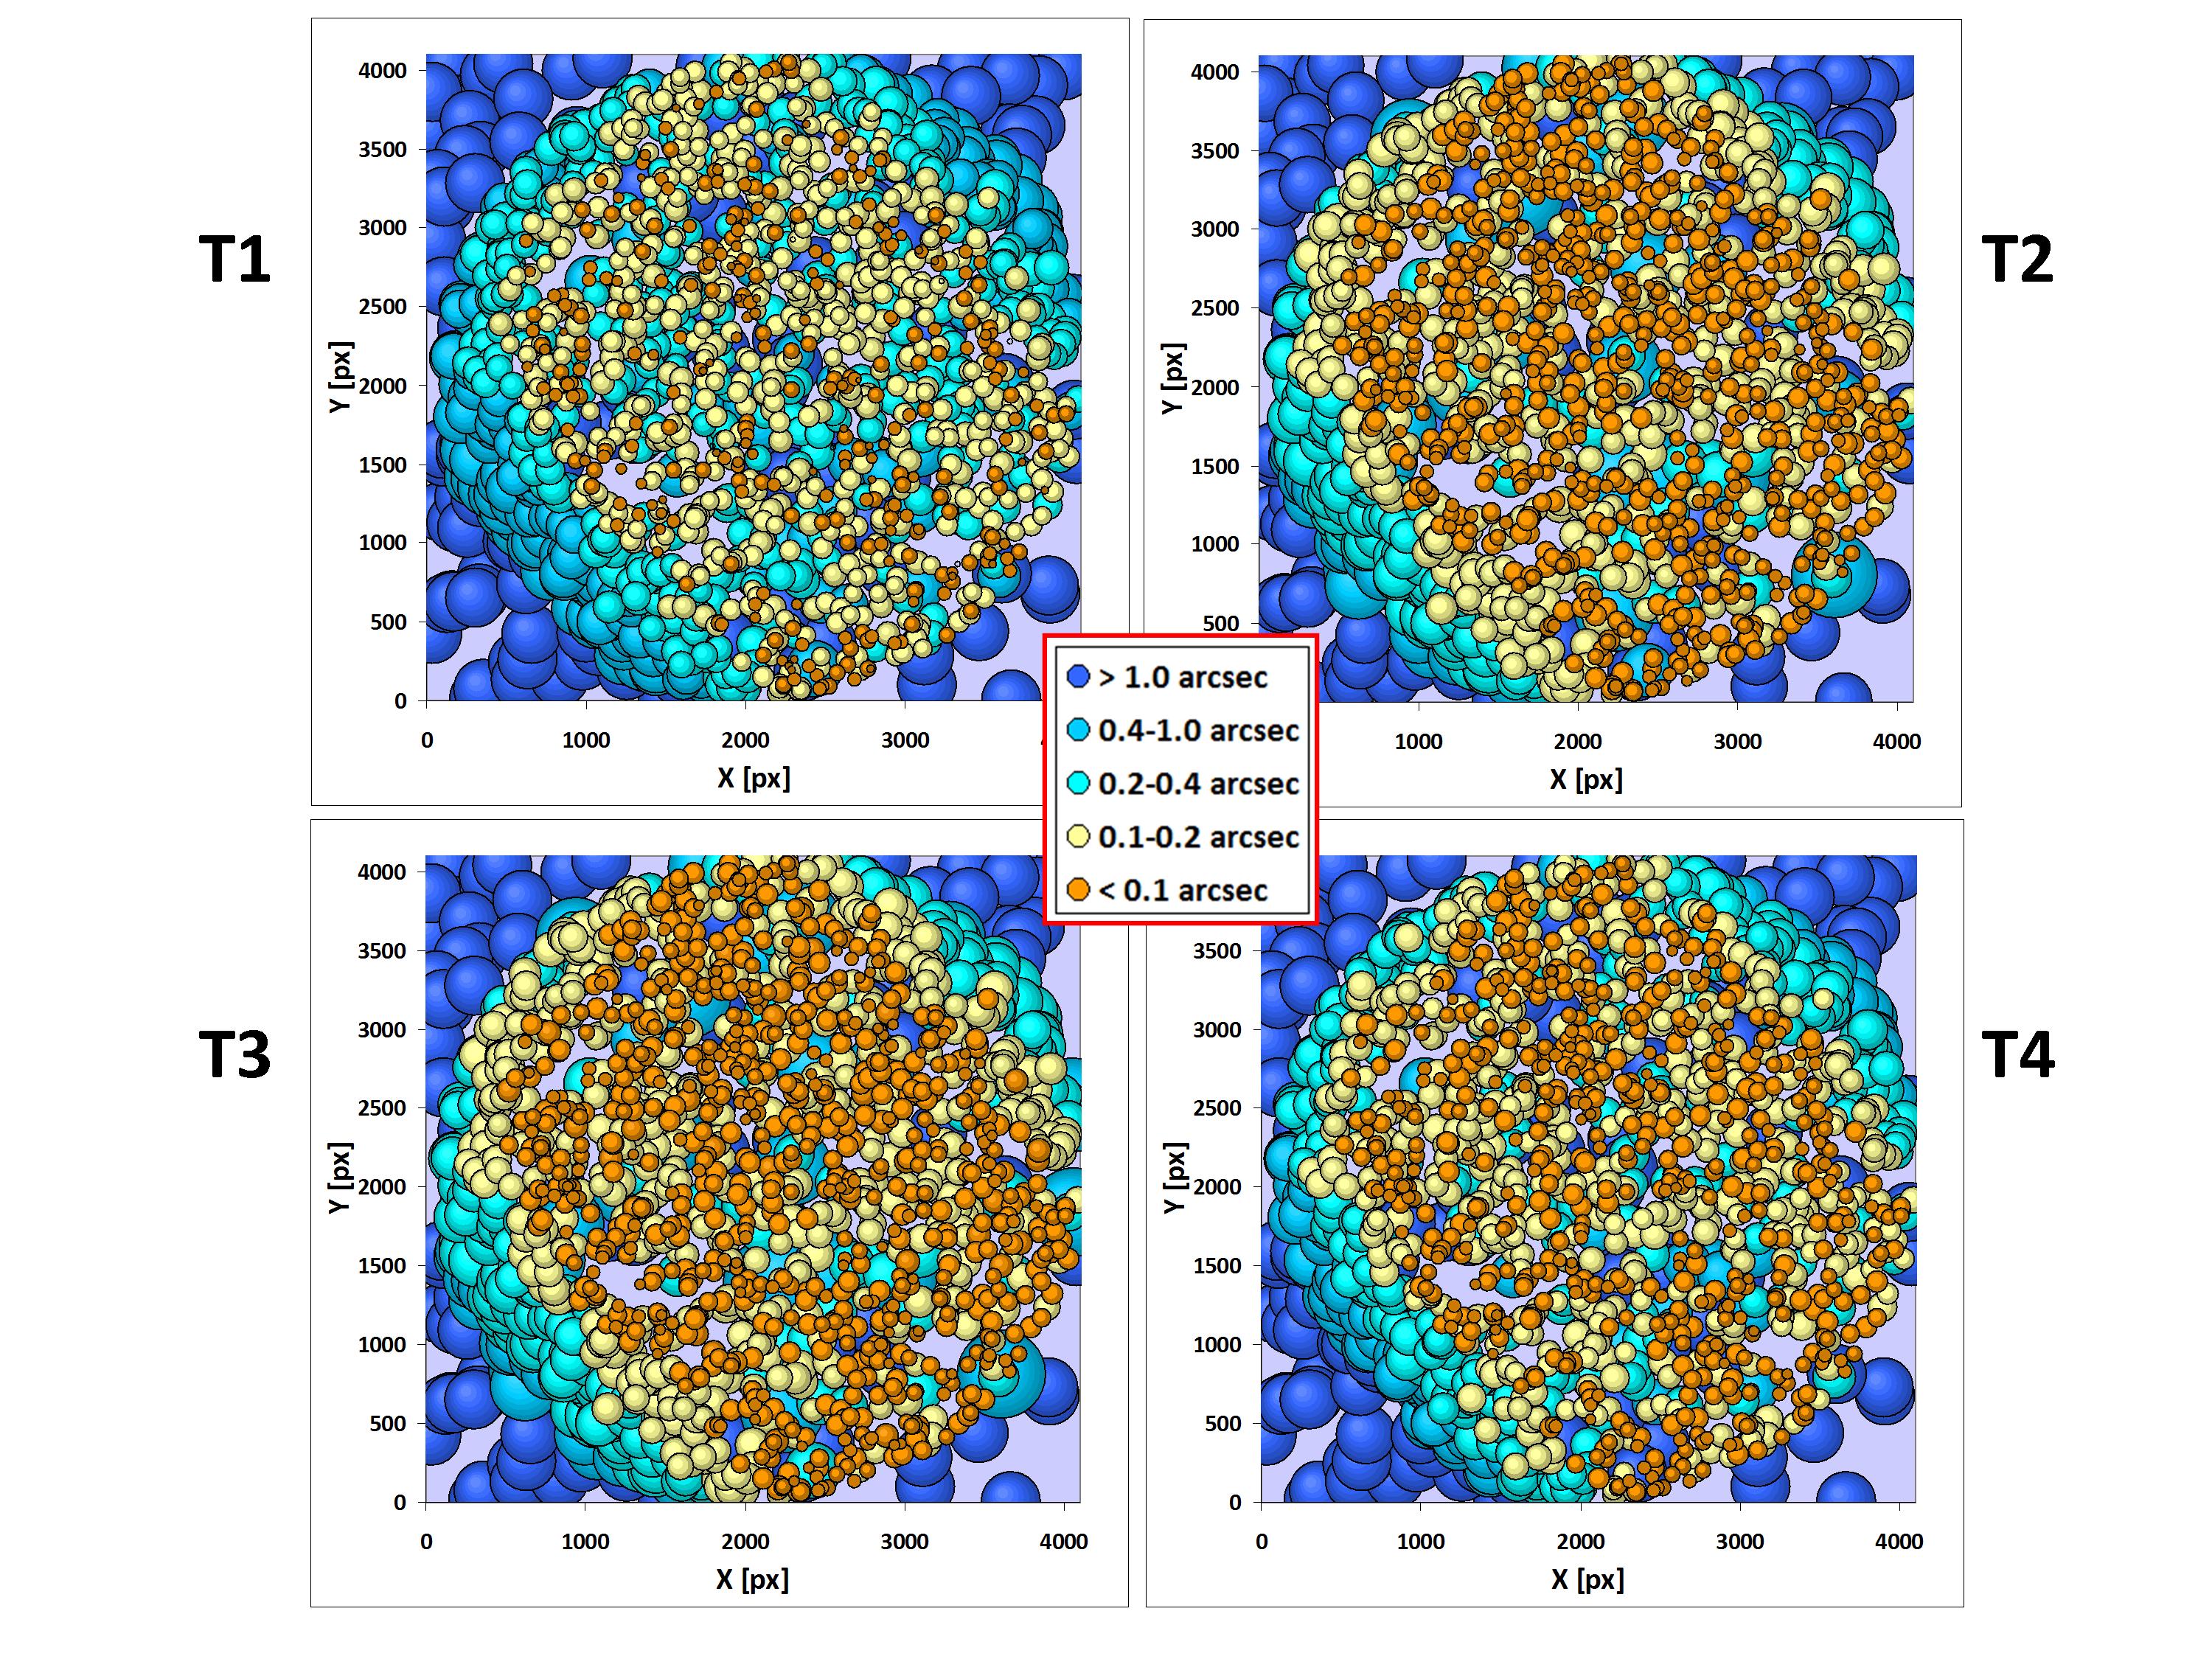 |
Figure 15 -
strometric accuracy of the four TANDEM telescopes (coded with T1, T2, T3
and T4 in the plots) across a 2o × 2o dense stellar field around the Landolt (1992) standard
PG1528+062. Each panel maps the 4096 × 4096 pixel GSense 4040 image. Plate-solve
solution was obtained independently for each telescope by relying on the Astrometrica +
Gaia DR2 catalogue, as a reference. Star size in the plots is proportional to the astrometric
uncertainty. As summarized in the central legend inset, orange dots are stars with astrometric accuracy of 0.1 arcsec
or better, yellow dots are for 0.1-0.2 arcsec, cyan dots are for the 0.2-0.4 arcsec range, pale blue dots are for 0.4-1.0 arcsec
residuals, and finally dark blue dots are for stars displaying astrometric residuals in excess to 1 arcsec.
|
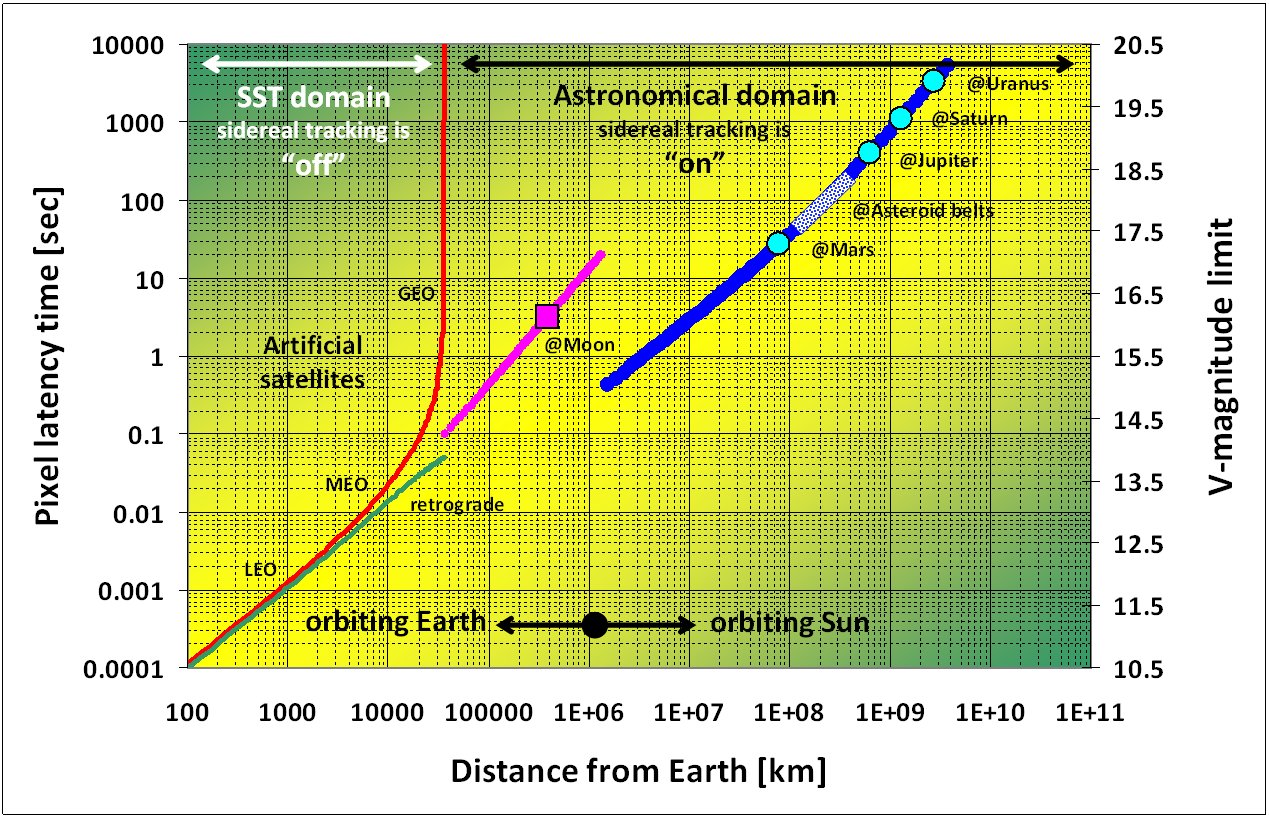 |
Figure 16 -
Pixel latency time (in seconds, left scale) across the TANDEM CMOS detector
for objects in motion according to different dynamical environments. Latency time directly
reflects into a magnitude threshold for objects detection (right scale), through eq. (13).
In particular, the SST domain includes Earth-orbiting artificial satellites and space debris
(both in prograde and retrograde motion, respectively red- and green-coded in the plot)
at the different orbital regimes, namely LEO, MEO and GEO (see, e.g. Pattan 1993, for
details), up to the circum-terrestrial outer edge about 35,786 km. For their special nature,
SST observations are typically carried out with telescope sidereal tracking off (see
Buzzoni 2024a, for further insights upon SST observing strategies). Magnitude threshold
for deep-space objects, at the Moon distance and beyond, as marked, is accounted by the
magenta curve. Detection limits for even farther Solar System objects, at increasing planetary
distances, are finally accounted by the blue curve, which also includes the illustrative
TANDEM detection threshold for main-belt asteroids. These observations usually requires
a more standard astronomical approach, with sidereal tracking on, as labelled on the plot.
|
| Tables | |
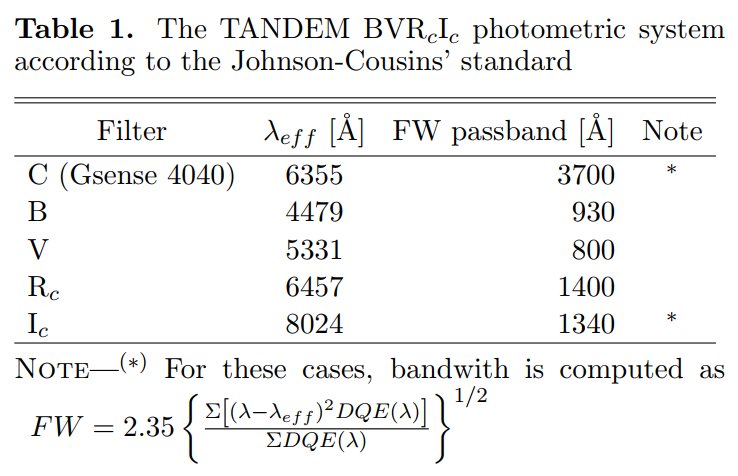 |
Table 1 -
The TANDEM BVRcIc photometric system according to the Johnson-Cousins standard
|
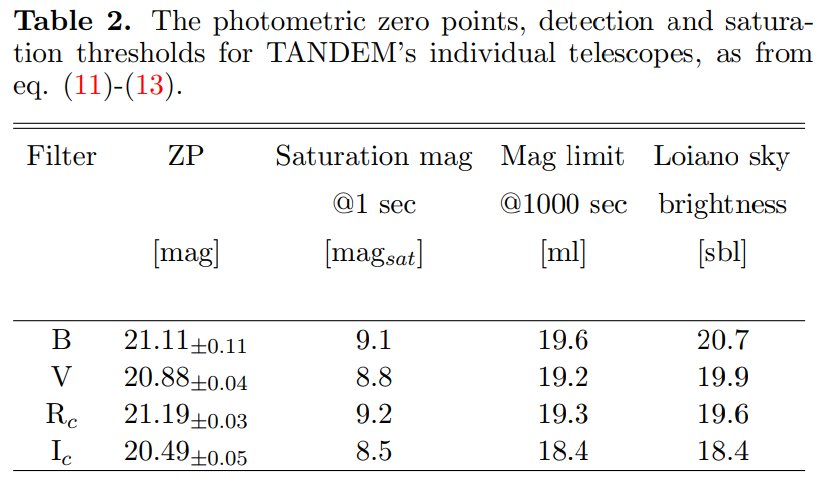 |
Table 2 -
The photometric zero points, detection and saturation thresholds for TANDEMs individual telescopes,
as from eq. (11)-(13).
|
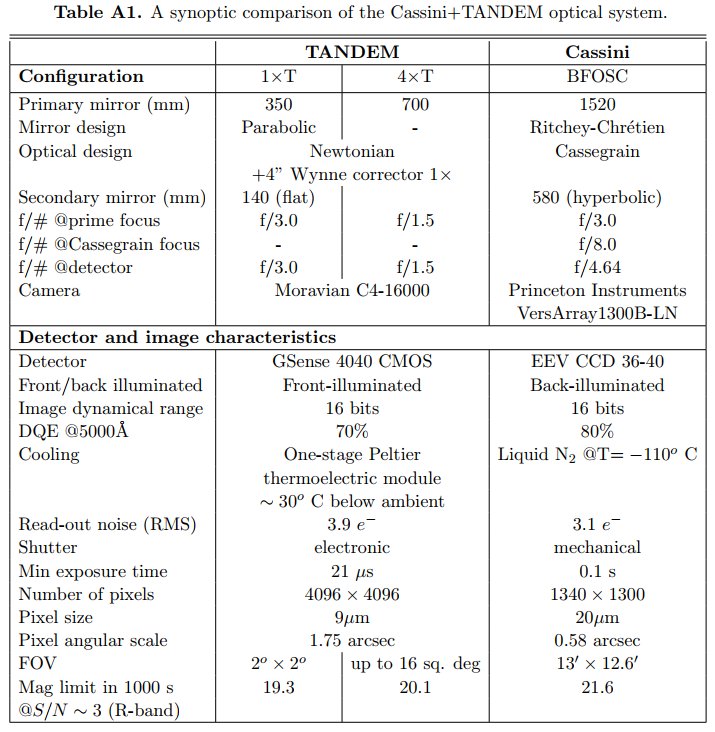 |
Table A1 -
A synoptic comparison of the Cassini + TANDEM optical system
|
Back to article listing |
|
Shortcut to Space Stuff |
| AB/Dic 2024 |
|
|