 ASCII file ASCII file
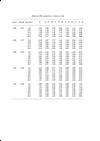
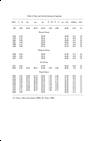
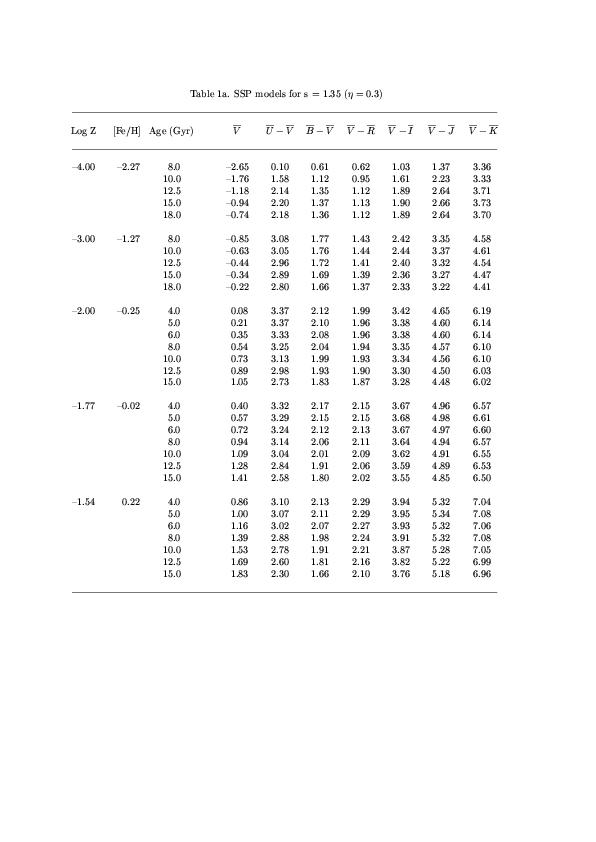
| Table 1a - SSP models for s = 1.35 (η = 0.3, R-HB) |
 ASCII file ASCII file
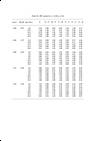
| Table 1b - SSP models for s = 1.35 (η = 0.5, R-HB) |
 ASCII file ASCII file
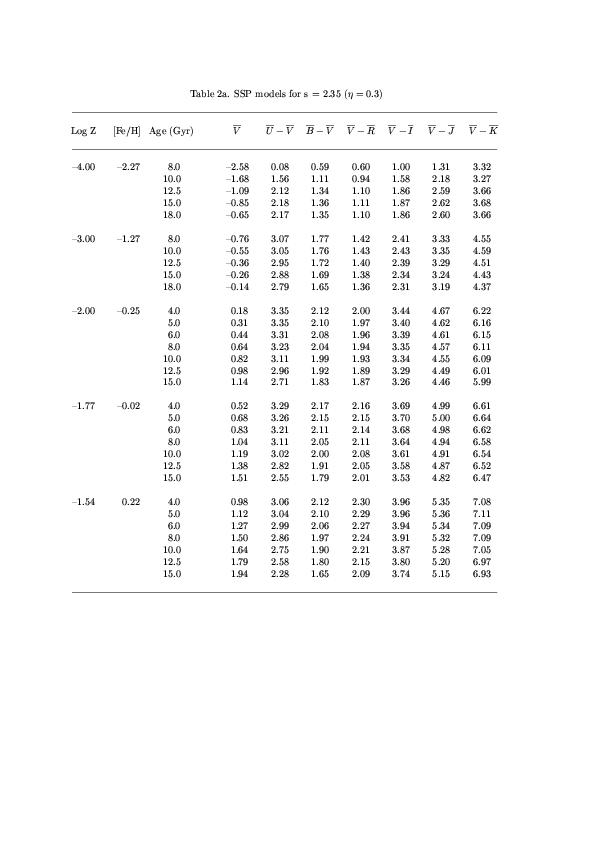
| Table 2a - SSP models for s = 2.35 (η = 0.3, R-HB) |
 ASCII file ASCII file
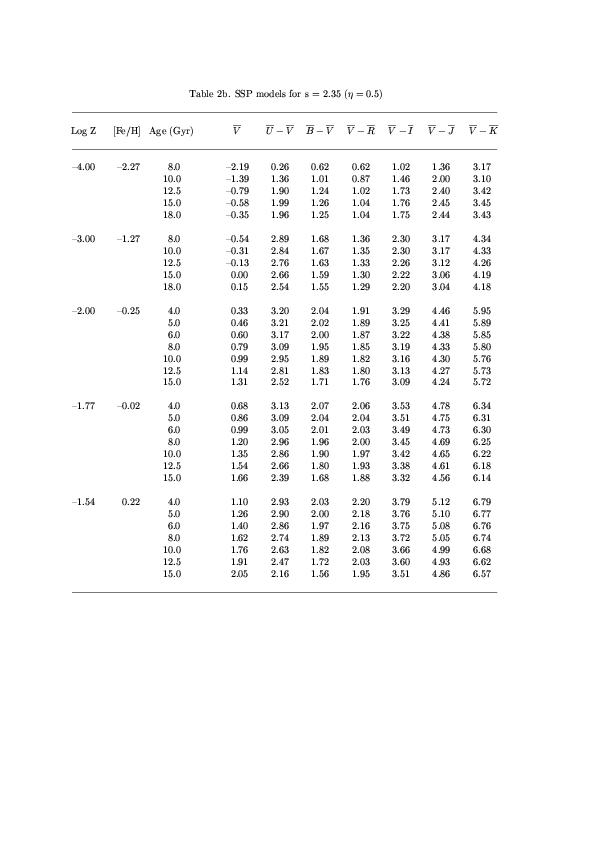
| Table 2b - SSP models for s = 2.35 (η = 0.5, R-HB) |
 ASCII file ASCII file
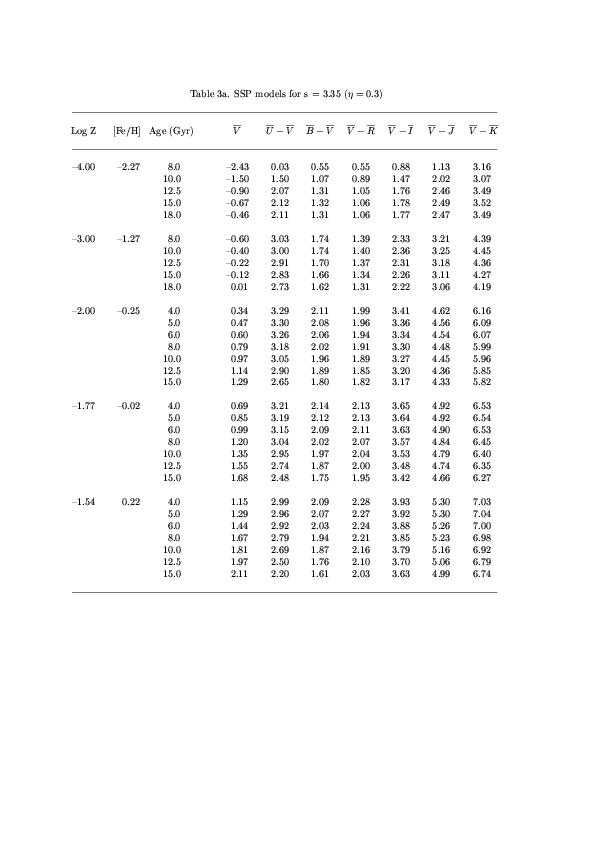
| Table 3a - SSP models for s = 3.35 (η = 0.3, R-HB) |
 ASCII file ASCII file
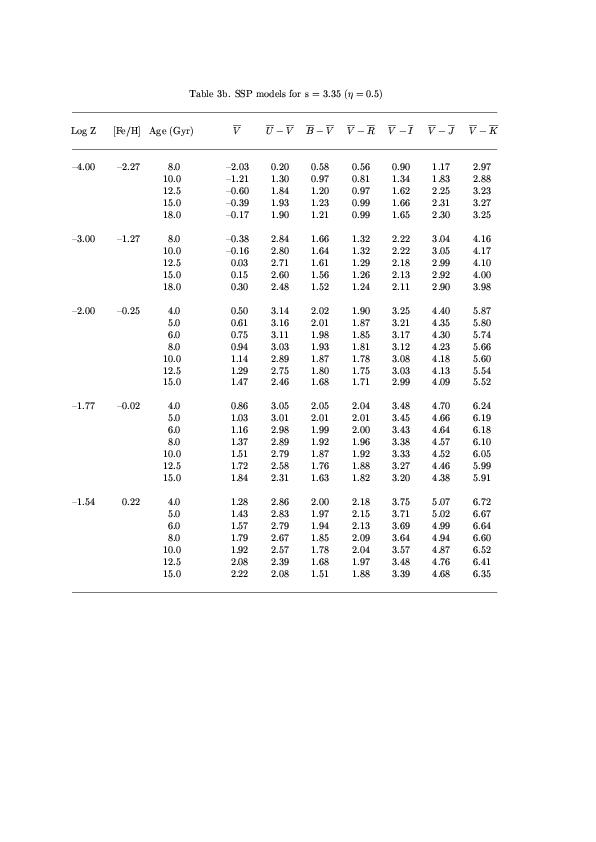
| Table 3b - SSP models for s = 3.35 (η = 0.5, R-HB) |
 ASCII file ASCII file
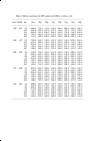
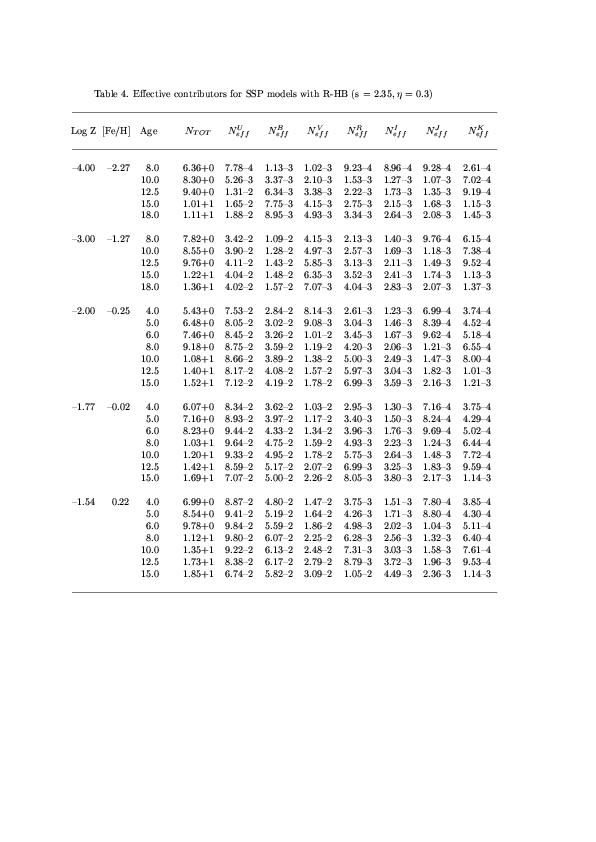
| Table 4 - Effective contributors for SSP models with R-HB (s = 2.35, η = 0.3, R-HB) |
 ASCII file ASCII file
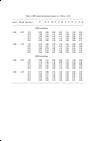
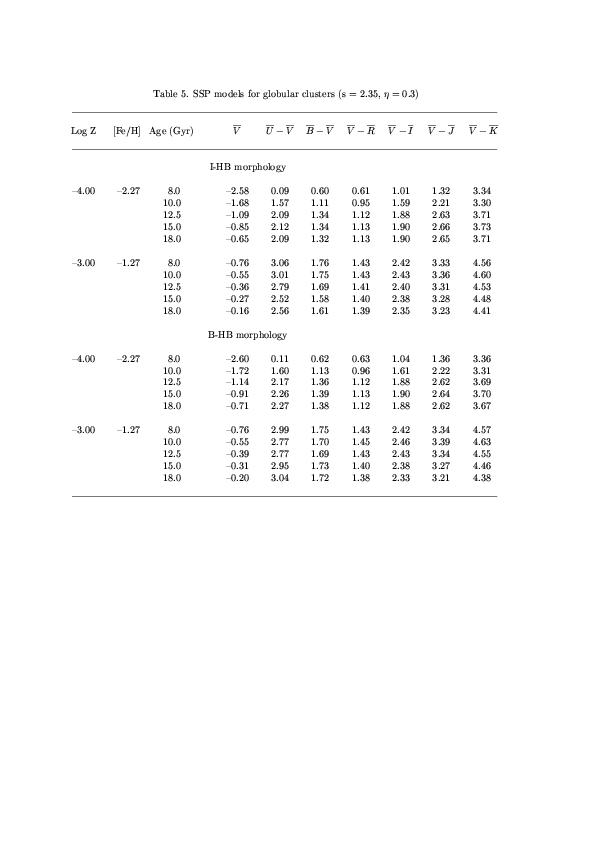
| Table 5 - SSP models for globular clusters (s = 2.35, η = 0.3) |
 ASCII file ASCII file
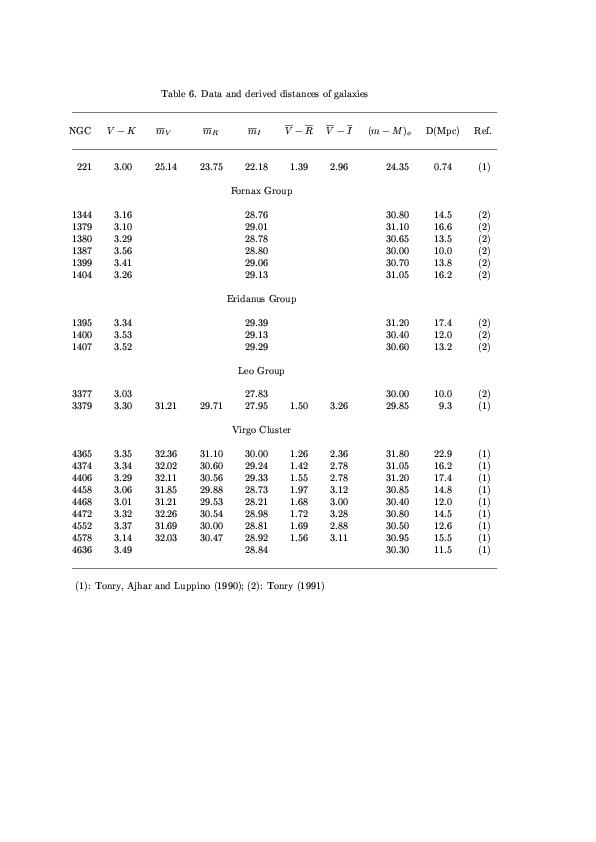
| Table 6 - Data and derived distances of galaxies |
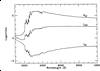
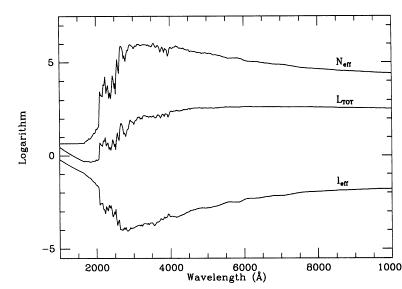
| Figure 1 - Logarithm of effective luminosity (l_eff) and number
contributors (N_eff) for a 15 Gyr simple stellar population of solar
metallicity with Salpeter IMF. A direct relationship links l_eff and
N_eff with the total luminosity of the population (L_TOT) also displayed:
i.e. L_TOT = l_eff x N_eff. Data have been normalized to a
total bolometric luminosity of 1E07 L_sun. |
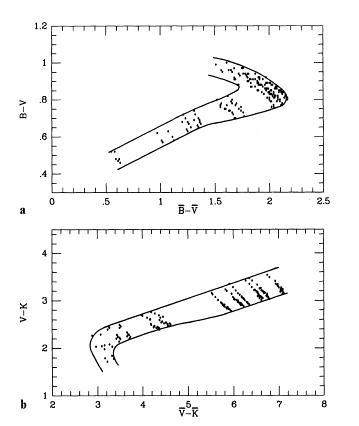
| Figure 2a,b - Effective and integrated colors for the SSPs of Table 1-3.
It is evident in panel (a) the hooked feature with effective (B − V)
turning back to the blue with increasing metallicity.
The same happens to effective (V − K) in panel (b), but in
the opposite sense and at low metallicity (see text for discussion).
Both (B − V) and (V − K) are from Buzzoni (1989). |
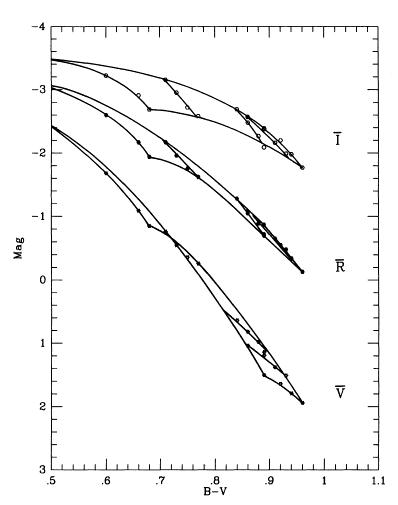
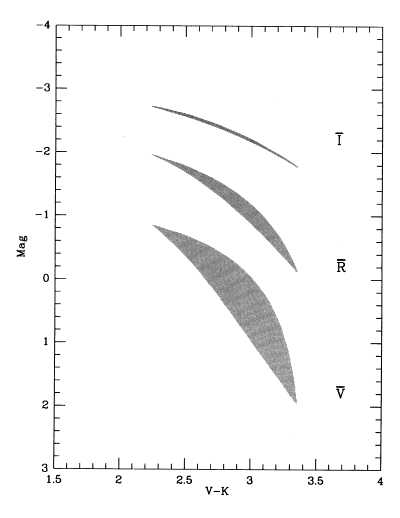
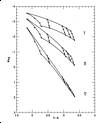
| Figure 3 - Effective magnitudes in the Johnson V, R, and I bands
of SSPs in Table 2a versus their integrated (B − V).
The upper envelope for the models in the different bands is for 8 Gyr
populations, while lower envelope is for 15 Gyr. Lines within the envelopes
trace time evolution of populations with fixed metallicity.
Note the complex behaviour of effective V at low metallicity. |
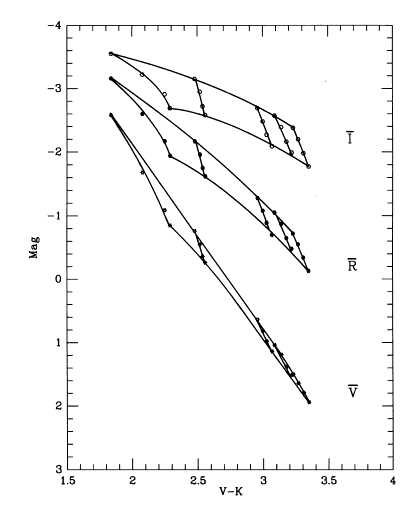
| Figure 4 - Same as Fig. 3, but versus integrated (V − K). |
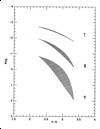
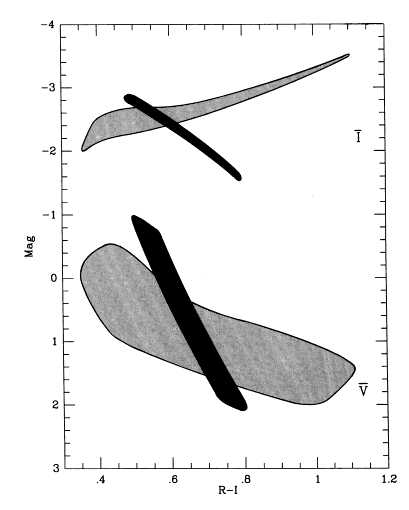
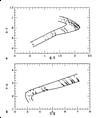
| Figure 5 - Effective magnitudes for composite stellar populations.
Each shaded area is defined by the envelopes at the different bands of
any possible stellar combination from a mixture of 15 Gyr SSPs listed in Table
2a. Both for effective V and R, the composite population
always results in a brighter effective luminosity at a given (V − K), with
models lying in the figure above the loci expected for SSps (i.e. the lower
edge in each envelope, cf. also Fig. 4). The opposite trend is found for
effective I, but with negligible departure of composite models from the loci for SSPs. |
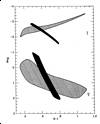
| Figure 6 - Comparison between the whole set of 15 Gyr models in Tables
1-3 (black strips) and the composite locus for the models of Tonry, Ajhar,
and Luppino (1990) (green areas). Both colors and effective magnitudes are
in the Johnson system. |
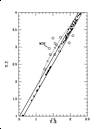
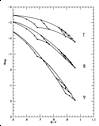
| Figure 7 - Comparison between effective colors expected for the SSP models
in Tables 1-3 and observations by Tonry, Ajhar and Luppino (1990) of elliptical
galaxies in the Virgo cluster (magnitudes are dereddened and transformed to
the Johnson system). The supplementary point for M32 is also marked. Galaxies
seem to lye at exceedingly low metallicities with respect to SSP models with
similar integrated colors. The reason is an excess effective V luminosity
causing bluer effective colors. As discussed in the text, this might be induced
by the contamination of a metal-poor stellar component.
The dashed line displays the change expected for a 15 Gyr Salpeter
SSP with [Fe/H]= +0.22 by adding an increasing fraction of a similar metal-poor
SSP with [Fe/H] = -2.27. Marked along the curve is a 10% and 20% total V contribution
of the metal-poor population moving to bluer colors. |

 ASCII file
 ASCII file
 ASCII file
 ASCII file
 ASCII file
 ASCII file
 ASCII file
 ASCII file
 ASCII file