 ASCII file ASCII file
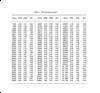
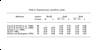
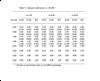
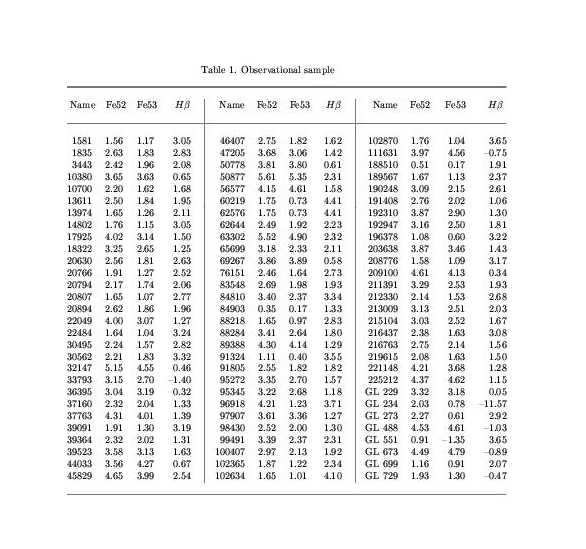
| Table 1 - Observational sample |
 ASCII file ASCII file
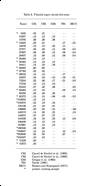
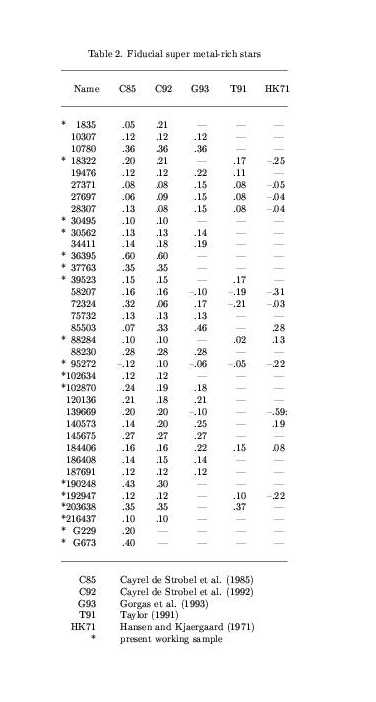
| Table 2 - Fiducial super metal-rich stars |
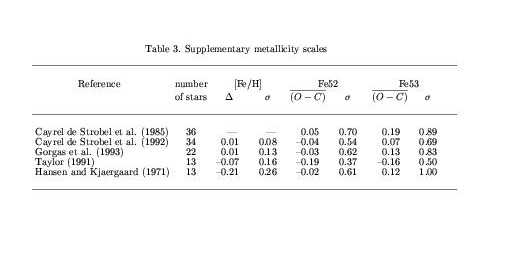
| Table 3 - Supplementary metallicity scales |
 ASCII file ASCII file
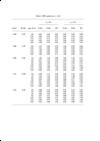
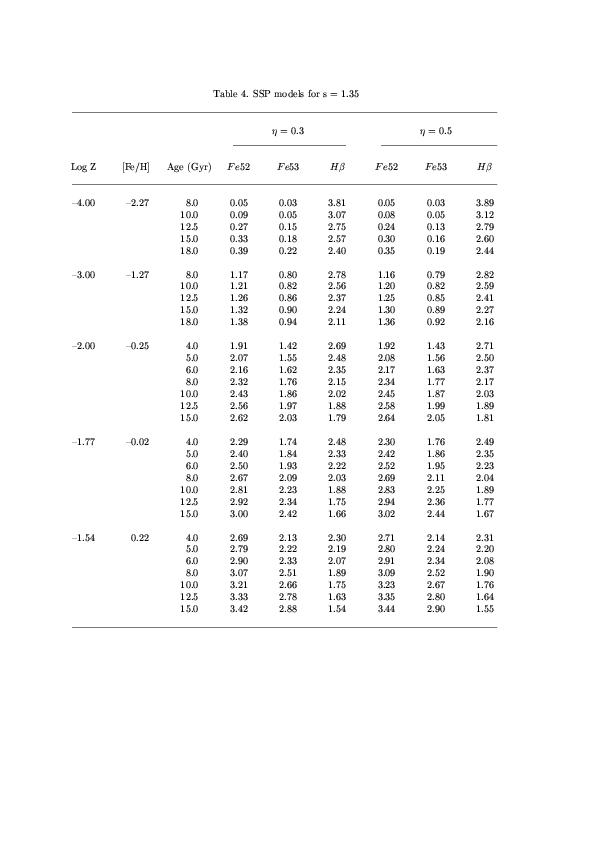
| Table 4 - SSP models for s = 1.35 |
 ASCII file ASCII file
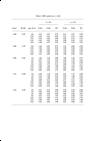
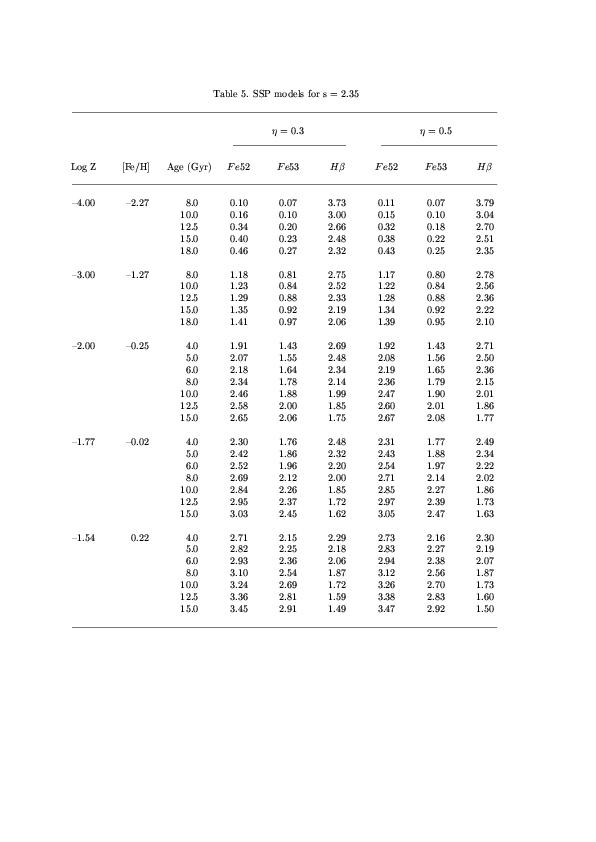
| Table 5 - SSP models for s = 2.35 |
 ASCII file ASCII file
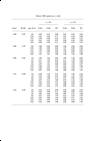
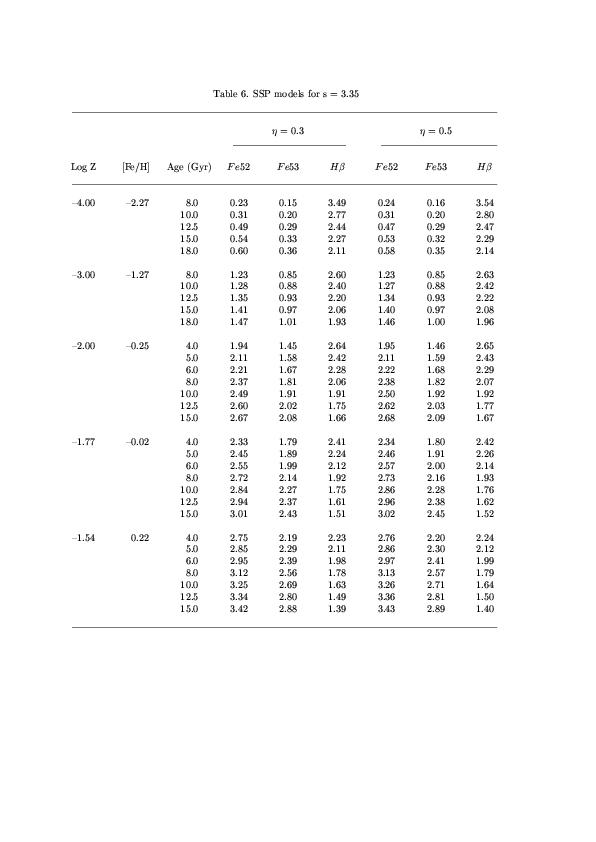
| Table 6 - SSP models for s = 3.35 |
 ASCII file ASCII file
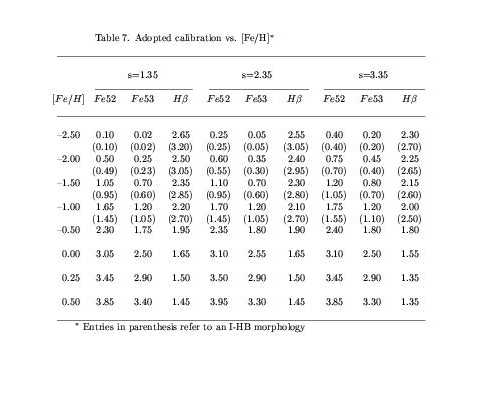
| Table 7 - Adopted calibration vs. [Fe/H] |
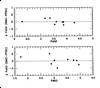
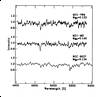
| Figure 1 - Calibration residuals of Fe52 and Fe53 indices for the nine
standard stars in common with Faber et al. (1985) (see Paper I for their HD
identification). The scatter of the points is σ(Fe52) = ± 0.16 Å
and σ(Fe53) = ± 0.30 Å. |
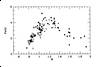
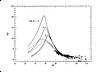
| Figure 2 -
Temperature dependence of Fe52. Displayed are 125 stars
in the present working sample and in the Faber et al. (1985) and Gorgas et al.
(1993) samples with [Fe/H] = ± 0.25 (red dwarfs are included disregarding
their [Fe/H]). Points are labelled according to their
gravity in the bins log g = [1.5-2.5] (open triangles),
[2.5-3.5] (solid triangles), [3.5-4.5] (open dots), and [≥ 4.5] (solid dots).
The trend is clearly evident with the index increasing with decreasing
temperature up to a maximum about Θ ~ 1.15 (T ~ 4300 K), and then fading toward red dwarfs. |
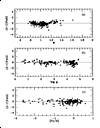
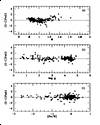
| Figure 3a, b, c -
Residuals of Fe52 from fitting eqs. (1)-(3) versus
stellar temperature, gravity, and metallicity. Displayed are the 74 stars
in the working sample (full dots) plus the 130 stars in the Faber et al. (1985)
and Gorgas et al. (1993) samples (open dots). The scatter of our points is
± 0.44 Å (± 0.51 Å for the global sample of 204 points). |

| Figure 4 -
Relationship between the two Iron indices Fe52 and Fe53
in our complete sample of 87 standard stars of Table 1.
The dashed line is the adopted relation Log Fe53 = 1.34 Log Fe52 - 0.264. |
| Figure 5a, b, c -
Residuals of Fe53 from adopted calibration. Points have
the same meaning as in Fig. 3. The scatter is ± 0.52 Å
in our working sample and ± 0.58 Å for the global sample of 204 points. |
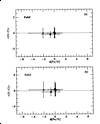
| Figure 6a, b -
Mean metallicity offsets vs. mean index residuals from
eqs. (1)-(3) for the whole sample of 36 super metal-rich stars
collected from present work, Faber et al. (1985), and Gorgas et al. (1993).
The Δ [Fe/H] is computed with respect to the metallicity scale in
Cayrel de Strobel et al. (1985) (solid dots). Supplementary metallicity
determinations are from Cayrel de Strobel et al. (1992) (open dots), Gorgas et al.
(1993) (triangles), Taylor (1991) (stars), and Hansen and Kjaergaard (1971) (crosses).
|
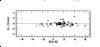
| Figure 7 -
Residuals of Fe52 from fitting eqs. (1)-(3) versus [Fe/H]
for the sample of 36 super metal-rich stars of Table 2 according
to different metallicity scales from Cayrel de Strobel et al. (1985, 1992),
Gorgas et al. (1993), Taylor (1991), and Hansen and Kjaergaard (1971).
Point markers as in Fig. 6.
|

| Figure 8 -
Calibration residuals of Hß for the nine standard stars in common with Faber et al. (1985).
The standard system is reproduced within σ(Hß) = ± 0.23 Å.
|
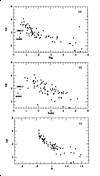
| Figure 9a, b, c -
Relationship between Hß index and Magnesium, Iron, and
temperature in the stellar working sample. In panels "a" and "b"
the two deviating points for metal-poor stars are labelled. Note also
the large scatter among red dwarfs for Mg2 ≥ 0.45 with Hß
both in absorption and emission. |
| Figure 10 -
Trend of Hß index at higher temperatures. Solid lines
display the equivalent width of the feature derived from the Kurucz (1979)
model atmospheres for three values of stellar gravity, i.e. Log g = 4, 3, 2.
Dashed lines display on the contrary the pseudo-equivalent widths for the same
gravities according to Faber's et al. (1985) definition of the index. The
large difference is due to overflow of the Stark broadened wings in the
feature at hot temperatures. Stars in our working sample and in the
Faber et al. (1985) and Gorgas et al. (1993) samples are displayed for reference
as full and open dots, respectively.
|

| Figure 11 -
Residuals of Hß from adopted calibration [eqs. (5)-(7)].
Points have the same meaning as in Fig. 3, with no systematic drift respect to
temperature, gravity and metallicity. Considering only the 68 stars in our
working sample warmer than 3600 K (i.e. Θ ≤ 1.4) the scatter is
± 0.34 A while including also the Faber et al. (1985) and Gorgas et al.
(1993) samples we have a total of 191 stars with a scatter of ± 0.36 Å.
|
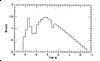
| Figure 12 -
Disaggregated contributions to the Fe52 feature from
stars of different gravity in a 15 Gyr Salpeter SSP with solar metallicity
and R-HB morphology.
The quantity displayed is the ratio of the relative contribution of
each stellar bin to the continuum and to the residual light in the absorption
feature. A value about 1.0 indicates that stars contribute with the same weight
both to continuum and to the line, while values in excess to unity means that
those stars mainly contribute to the absorption feature.
It is immediate to see that integrated Fe52 is mainly contributed by stars at
the base of the RGB about Log g ~ 3.0. |
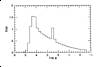
| Figure 13 -
Same as in Fig. 12 but for Hß. One sees that the index better responds to
stars in the upper MS about Log g ~ 4.1. The bump in the histogram about. |
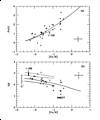
| Figure 14a, b -
Adopted calibration of Fe52 and Hß indices versus [Fe/H].
Full and open dots represent Galactic and M31 globular clusters, respectively.
Data are from Burstein et al. (1984) while metallicity scale is from Brodie
and Huchra (1990). Typical error bars for the observations are also displayed.
Solid lines are model sequences for 15 Gyr Salpeter SSPs
with R-HB morphology and standard metal mix (i.e. [CNO/Fe] = 0). Dashed lines
display the change adopting an I-HB.
In panel "b" the effect of adopting O-enhanced isochrones for metal-poor
populations is explored (labelled O+). Both I- and R-HB sequences are
decreased by about 0.3 A allowing a better match to the data. The extreme
discrepant case of NGC 6637 (M69) is also marked (see text for discussion).
|
| Figure 15 -
Comparison between the spectrum of the Galactic globular
cluster NGC 6637 (M69) and two clusters in M31 with similar metallicity
inferred through the Mg2 index. It is evident the strong Hß deficiency
in the Galactic cluster, possibly indicating an exceedingly low temperature
of the turn off region in the stellar population of the cluster.
Observations of NGC 6637 come from our observational run (see Paper I
for details), and spectrum has been degraded to a resolution of
10 A in order to compare consistently with M31 clusters.
Data for M31-V64 and M31-MII are unpublished observations of Battistini et al.
(1987) taken at the russian BTA-SAO 6m telescope.
|

| Figure 16a, b -
Adopted metallicity calibration in the observational planes
Fe52/Mg2 and Hß/Mg2. Full and open dots are Galactic and M31
globular clusters from Burstein et al. (1984), while star and asterisk markers
are for elliptical galaxies from Gorgas, Efstathiou, and Aragon Salamanca
(1990), and Worthey, Faber and Jesus Gonzalez (1992), respectively.
Solid curves in both panels indicate the locus expected for standard 15 Gyr
Salpeter SSP with R-HB. Increasing values for [Fe/H] from -2.5 to +0.5 are
marked along the curve every 0.5 dex in the sense of increasing Mg2.
The effect of adopting an I-HB morphology at low metallicities (i.e.
for Mg2 ≥ 0.2) is displayed in both panels by the dashed lines, while
in panel "b" also the effect of O-enhanced models is accounted for (labels O+).
The Fe52 distribution for galaxies in panel "a" is better matched if
the direct dependence of the index on stellar metallicity in the
fitting functions [eqs. (1)-(3)] is neglected (dashed curve about
Mg2 ~ 0.28). See text for discussion. |

| Figure 17 -
Evolutionary sequences from 5 to 15 Gyr for three stellar
populations with [Fe/H] = -0.5, 0.0, +0.5 (thick solid lines from bottom
to top, respectively). Age increases in the sense of increasing Mg2.
Short-dashed curves are envelopes at 5, 10, and 15 Gyr with changing
metallicity. Point markers as in Fig. 16. The galaxy NGC 4742 is
singled out (see text for discussion). |

 ASCII file
 ASCII file
 ASCII file
 ASCII file
 ASCII file
 ASCII file