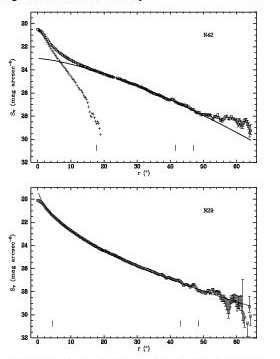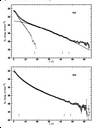
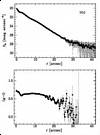
| Figure 1 -
V band surface brightness profiles of galaxies N42
(top) and N29 (bottom). Sersic law fits are shown as
solid lines. Small ticks show the inner and the two outer (σ _SKY
and σ /2_SKY) radius cutoffs in C99 model fitting. Crosses show the
bulge component of N42 after model subtraction.
The fitting shape parameter N results 1.43 for N42 and 0.54 for N29.
|
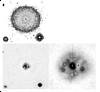
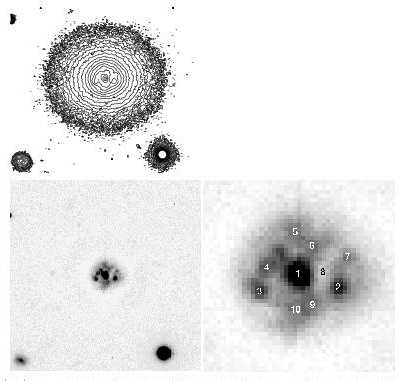
| Figure 2 -
Top: 1' x 1' contour plot (g band) of N50. The faintest and brightest contours displayed are 25 and
20 mag/", respectively, with 0.25 mag/" separation between concentric contour levels. North
is up and East to the left. Bottom left: greyscale plot after subtraction of a Sersic
model. Orientation and scale are the same as in the upper panel. Bottom right: Enlarged view (15" x 15") of
the central region with identification for the knots (see Table 1). |
| Figure 3 -
Top: The g-band surface brightness profile of N50. Error bars account for photometric
errors and uncertainties in the sky level. Bottom: The resulting (g − i) colour profile of the galaxy. |
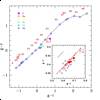
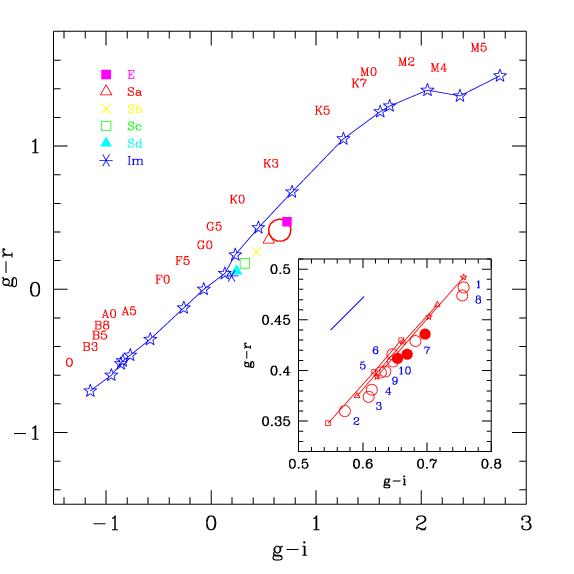
| Figure 4 -
(Main panel) - Two-colour diagram comparing N50
integrated (g − r) and (g − i) (big open dot) with the stellar Main
Sequence from the Vilnius spectral atlas (star markers) and with
Buzzoni's (1998, 2000) 15 Gyr galaxy models for different
Hubble types, as labelled top left. (Insert panel) -
N50 aperture photometry (solid dots) and individual colours of the
visible knots in the galaxy central region (open dots with
identification labels according to Table 1. Aperture
photometry is for circular spots at 2.5", 10", and
30" from galaxy centre. Colours become bluer at larger
distance. Buzzoni's (1989) SSP evolutionary sequences for 5,
10, and 15 Gyr (in the sense of redder colours) are superposed (thin
solid lines). Model metallicity is for [Fe/H] = -0.25 (squares), 0.0
(triangles) and +0.3 (stars). A reddening vector for E(B-V) = 0.03
mag is displayed top left in the panel. |
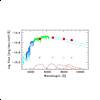
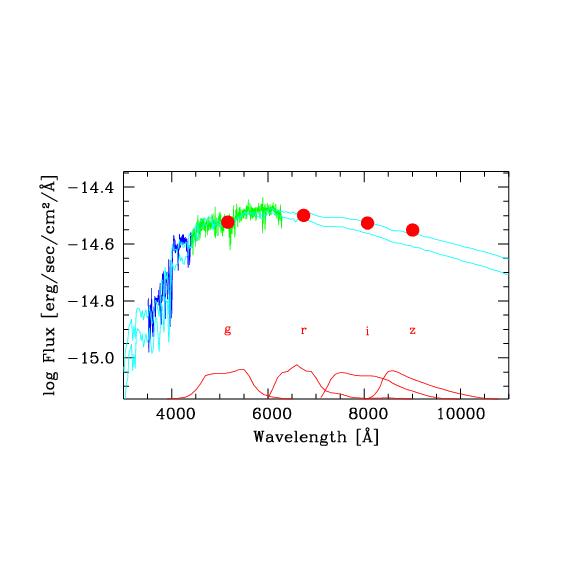
| Figure 5 -
Composite spectral energy distribution of galaxy N50. The
CASLEO spectrum, in the range 3500 ≤ λ ≤ 4400 A has
been matched to ESO observations (4400 ≤ λ ≤ 6300 A) while
integrated g, r, i, and z Gunn magnitudes have been converted
into monochromatic fluxes. Absolute flux calibration reproduces galaxy
energy distribution within the central 15" aperture.
Two SSP models from Buzzoni (1989), with [Fe/H] = -0.25 and age 5 and
15 Gyrs, are superposed on the plot (thin solid lines, the older model is the
``redder'' one). |
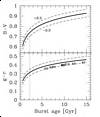
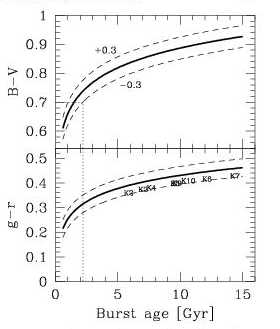
| Figure 6 -
Expected (B − V) and (g − r) star-burst colour evolution according
to Buzzoni (1989, 1998). Three different values for [Fe/H] = -0.3,
0.0 (solid lines), and +0.3 are displayed, as labelled on the (B − V)
plot. The indicative age distribution of the N50 central knots is
also reported in the (g − r) plot (assuming [Fe/H] = -0.25). Note
that, in general, even any massive starburst episode older than 2 Gyr,
superposed to a galaxy old stellar component would not be able to turn
integrated colours bluer than (B − V = 0.7 still allowing galaxy to be
recognized as a quiescent ``standard'' elliptical according to the
YC00 colour selection criterium. |
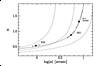
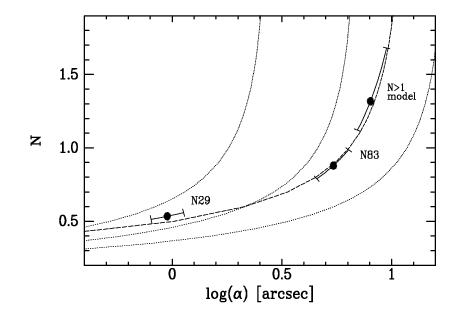
| Figure 7 -
Shape parameter (N) vs. pseudo scalelength (α) for
two galaxies in the Cellone (1999) NGC 5044 Group sample and a simulated
N > 1 model. Bars represent the spanned range of the (N, α) parameters
after varying the sky level by ± 20% of the sky rms. The dashed line is
the Young and Currie (2001) polynomial fit to Fornax Cluster dwarfs. Dotted lines
are galaxy loci for different constant luminosity (see text for details). |