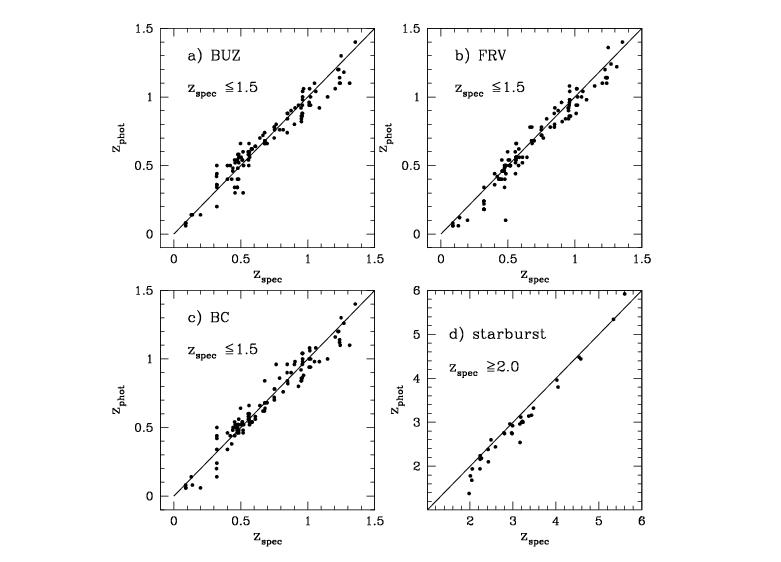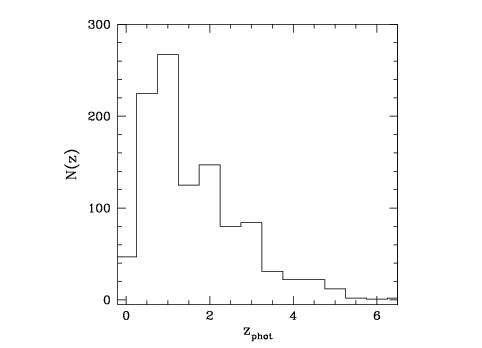
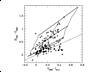
| Figure 1 -
Comparison between spectroscopic and photometric redshifts
according to different template libraries (see the text for
acronyms). The solid line is for Δ z = 0.0. Note the different
scale for panel "d".
|
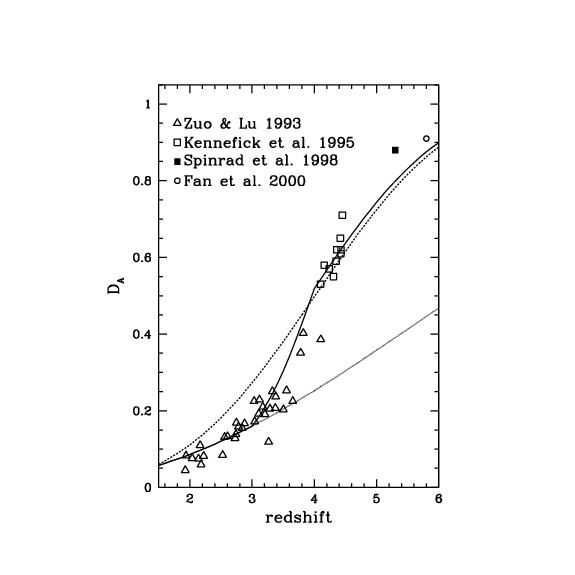
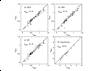
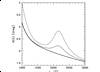
| Figure 2 -
The deficit D_A in quasars fluxes due to the
accumulated absorption of the Lyα forest. The dashed line is
obtained by describing the IGM opacity according to the prescriptions
by Madau (1995), while the dotted line are those by Scott et al. (2000).
The solid line is the model adopted in this paper.
References for the data points are indicated. The small difference
between the Madau values of D_A and ours at z > 4 is due
to the contribution of Ly limit systems (Madau 1995, Eq. (13)),
which was not included in Madau's formulation.
|
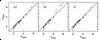
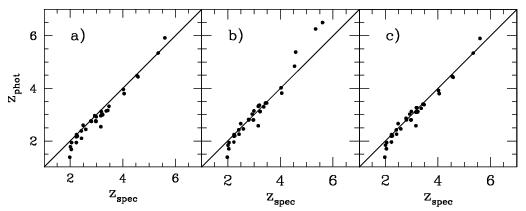
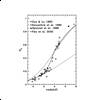
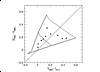
| Figure 3 -
Comparison between spectroscopic and photometric redshifts at
z_spec ≤ 2. Panel "a": the IGM opacity follows the
prescription by Madau (1995); panel "b": by Scott et al. (2000);
panel "c": the formulation discussed in this paper. The solid line
is for Δ z = 0.0. It should be noted that when the Scott
et al. (2000) results are adopted, the IGM opacity is underestimated at
z > 3.5, and, as a consequence, photometric redshifts overestimate
the spectroscopic ones.
|
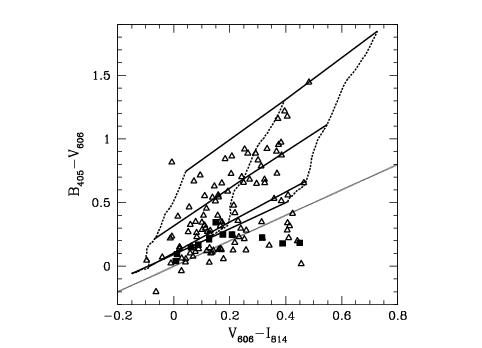
| Figure 4 -
Observed colors of U drop-out galaxies (triangles),
galaxies with spectroscopic redshifts in the range 2 < z < 2.5
(filled squares), and model colors of starburst galaxies in the
redshift range 2 < z < 3.5 (see the text for details). Dashed
lines show the color evolution of templates for increasing redshift
(from bottom to top) at E(B-V) = 0.0, 0.2, 0.4 (from left to
right). Solid lines define reddening vectors at
z = 2.0, 2.5, 3.0, 3.5 (from bottom to top), that is, the loci of
templates at fixed redshift with variable amounts of dust. The dotted
line corresponds to B_450 − V_606 = V_606 − I_814.
|
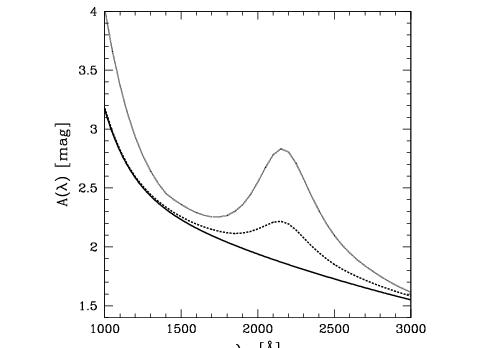
| Figure 5 -
Differential dust absorption (for E(B-V) = 0.2) according to
Calzetti's law (solid line), a superposition of Calzetti's law with a
2175 A bump of amplitude α = 0.25 (dashed line), and the
Seaton (1979) extinction curve for the Milky Way (dotted line).
|
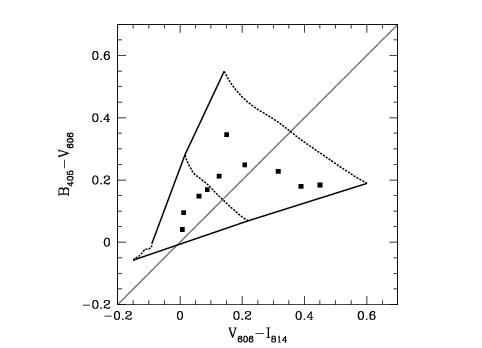
| Figure 6 -
Observed colors of spectroscopic galaxies (squares) and model
colors of starburst galaxies in the redshift range 2 < z < 2.5.
Dashed lines and solid lines have the same meaning as in
Fig. 4, but in this case reddening in colors due to dust
absorption is obtained superimposing on Calzetti's law a 2175 A
bump with amplitude α = 0.25. Again, the dotted line corresponds
to B_450 − V_606 = V_606 − I_814. As a
consequence of the rotation of the reddening vectors, model
colors are able to describe galaxy colors with
(B_450 − V_606) < (V_606 − I_814).
|
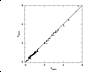
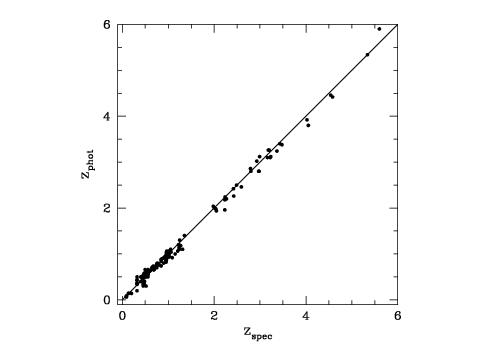
| Figure 7 -
Comparison between spectroscopic redshifts and photometric
estimates obtained with the BUZ library plus Leitherer et al. (1999)
models in the entire redshift interval 0 < z < 6. At
z_spec ≥ 2, the ISM and IGM opacities follow the rules
introduced in this work. The solid line is for Δ z = 0.0.
|
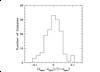
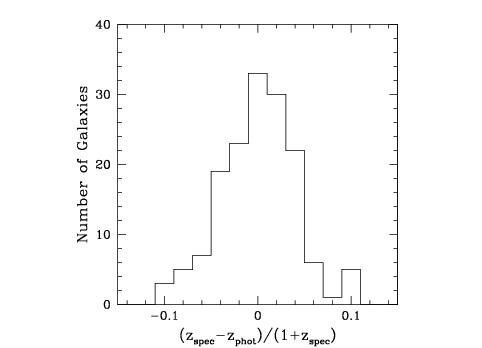
| Figure 8 -
The distribution of residuals between z_spec and
z_phot, normalized to (1+z_spec).
|
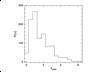
| Figure 9 -
The redshift distribution of HDFN galaxies.
|