 |
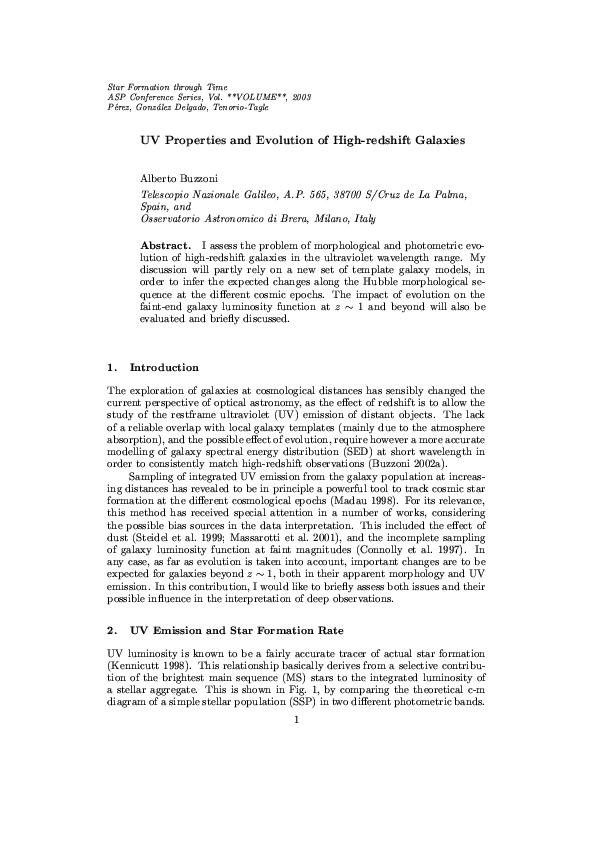
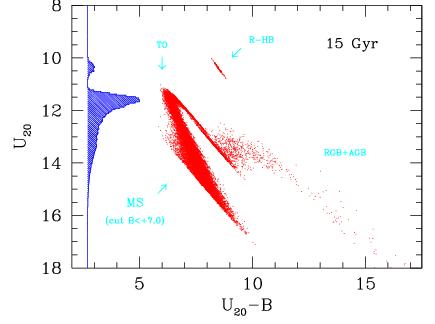
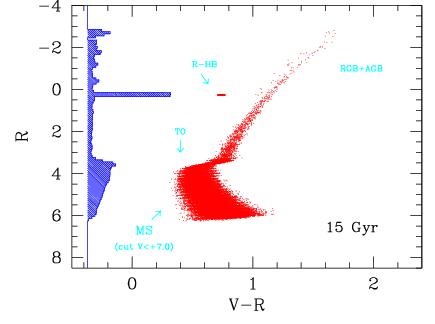
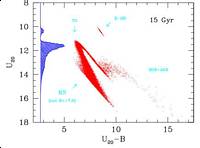
Figure 1 - Synthetic c-m diagrams for a 15 Gyr SSP of solar metallicity and Salpeter IMF, after
Buzzoni (1989). The left panel shows the magnitude distribution of stars at 2000 Å, U(20), compared
with the corresponding distribution in the Johnson R band (right panel). The histogram on the vertical
axis displays the relative fraction to the integrated SSP luminosity from stars in the different magnitude bins.
While in the U(20) diagram most of SSP luminosity is provided by stars around the turn off region,
this is not the case for the R diagram, where there is a sizable contribution from Post-MS stars
(i.e. horizontal branch, R-HB, and red giant branches, RGB+AGB) |
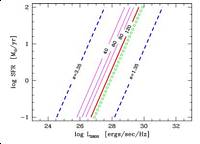 |
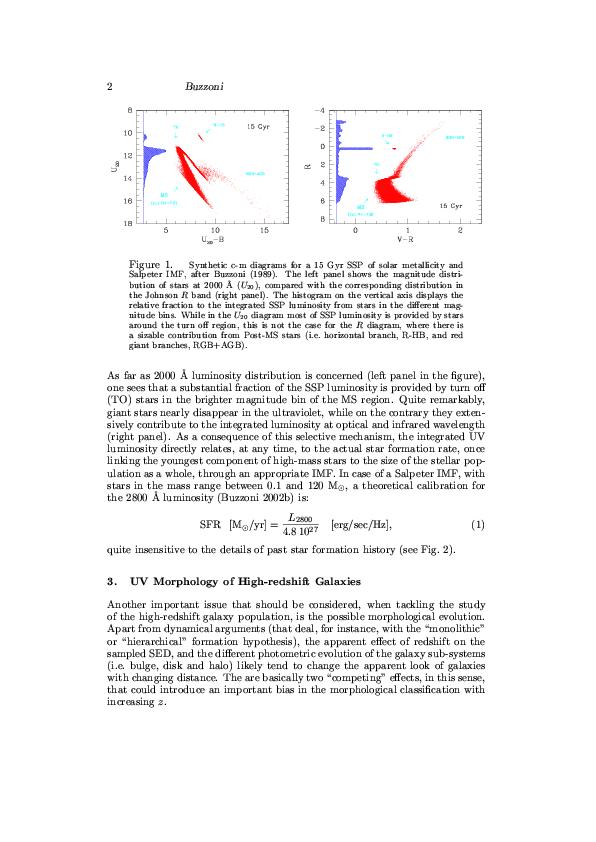
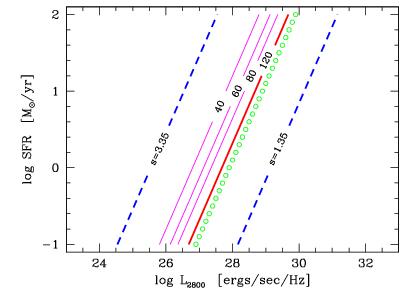
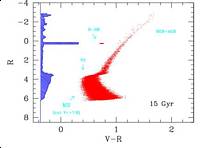
Figure 2 - Theoretical calibration of star formation rate and 2800 Å integrated luminosity
of a stellar population, after Buzzoni (2002).
Thick solid line is the expected relationship for a Salpeter IMF with stars up to 120 M_sun.
A change of the upper cutoff mass for M_up = 80, 60, 40 M_sun is diplayed
by the thin parallel lines, as labelled. Dashed lines report the change in the IMF power-law slope
(namely dN = A M**(-s)dM) for dwarf- (s = 3.35) and giant-dominated
(s = 1.35) stellar populations. Dotted line is the corresponding calibration from Madau (1997) for
a Salpeter IMF (s = 2.35) and M_up = 125 M_sun. |
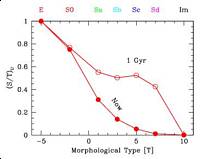 |
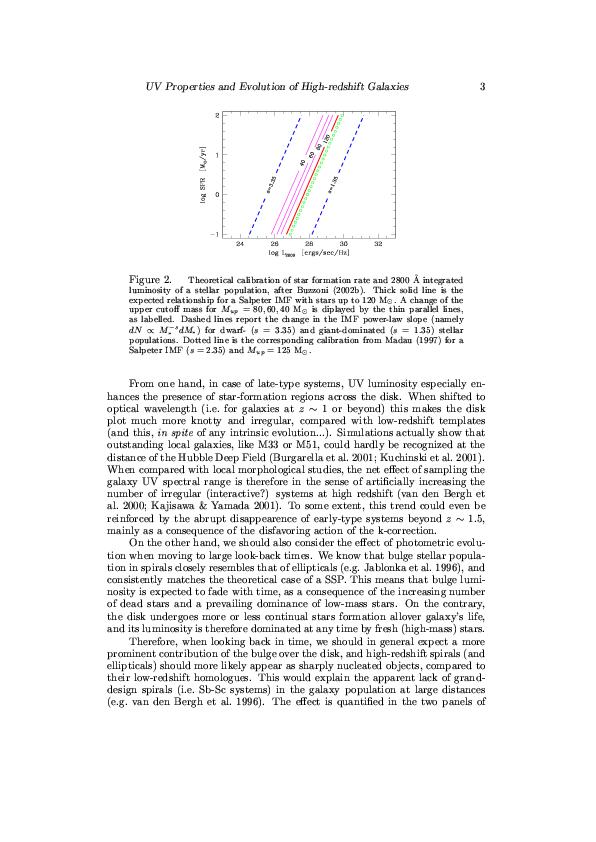
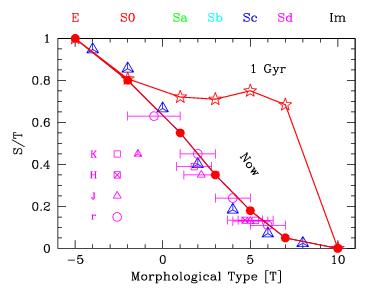
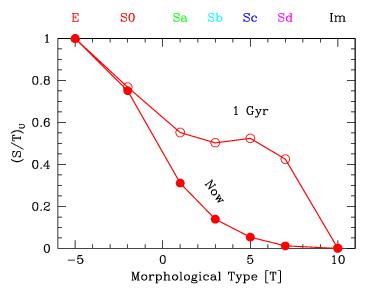
Figure 3 - The S/T morphological parameter, defined as L_(spheroid)/L_(tot), is studied at
different ages for galaxies along the Hubble sequence. Left panel displays the present-day calibration
(solid dots) at long wavelength, as derived from the data of Kent (1985; open dots),
de Jong (1996; filled triangles), Giovanardi & Hunt (1988; filled squares), and Moriondo et al. (1998;
open triangle and open squares). Its inferred trend in the Johnson U band is plotted in the right panel,
according to the template galaxy models of Buzzoni (2002). The expected evolution for t = 1 Gyr clearly
points to a strongly enhanced bulge contribution, especially for later-type spiral systems (Sc-Sd types), that
would closely resemble present-day S0-Sa galaxies. |
 |
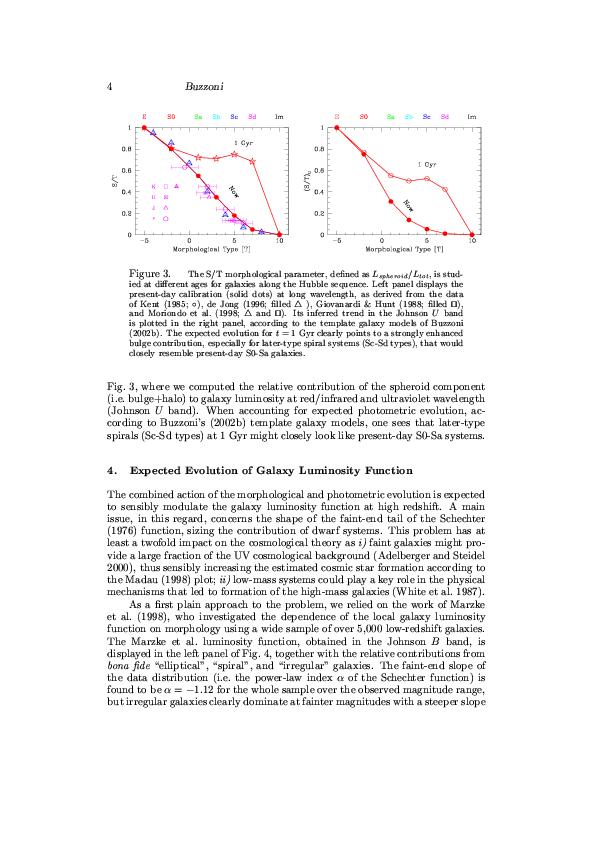
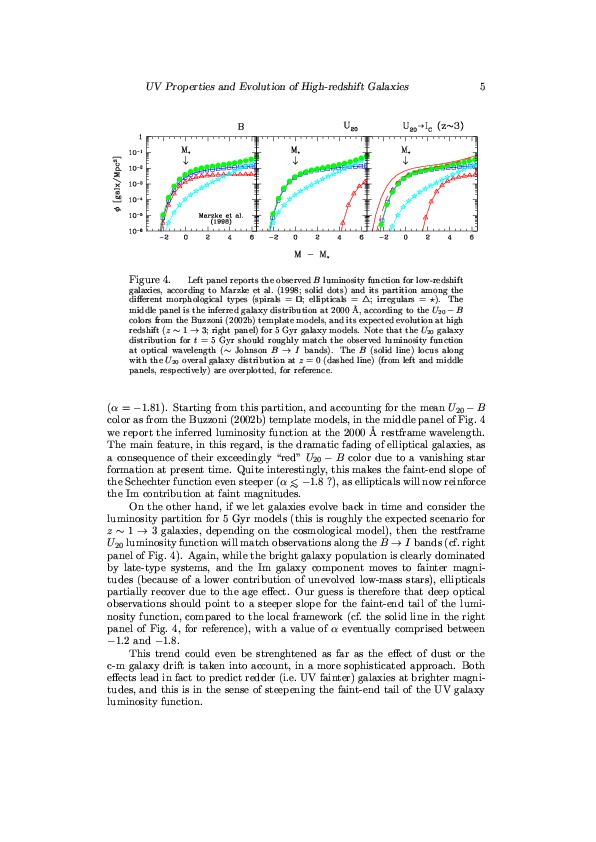
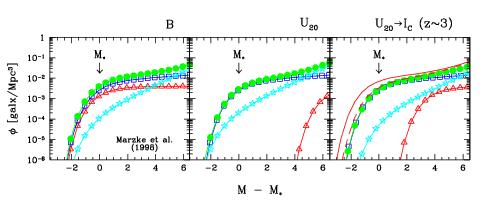
Figure 4 - Left panel reports the observed B luminosity function for low-redshift
galaxies, according to Marzke et al. (1998; solid dots) and its partition among the different morphological types
(spirals = open squares; ellipticals = triangles; irregulars = stars).
The middle panel is the inferred galaxy distribution at 2000 Å, according to the U(20)-B colors
from the Buzzoni (2002) template models, and its expected evolution at high redshift (z~1 to 3; right panel)
for 5 Gyr galaxy models. Note that the U(20) galaxy distribution for t = 5 Gyr should roughly match
the observed luminosity function at optical wavelength (~Johnson B to I bands).
The B (solid line) locus along with the U(20) overal galaxy distribution at z = 0 (dashed line)
(from left and middle panels, respectively) are overplotted in the right panel, for reference.
|