|
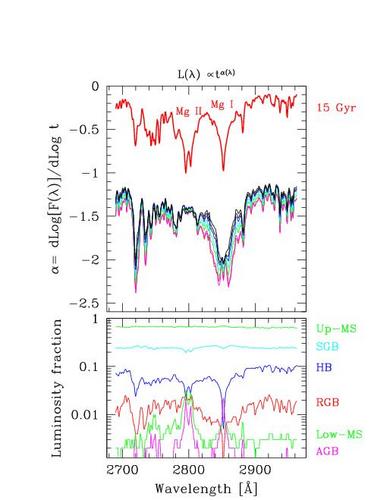
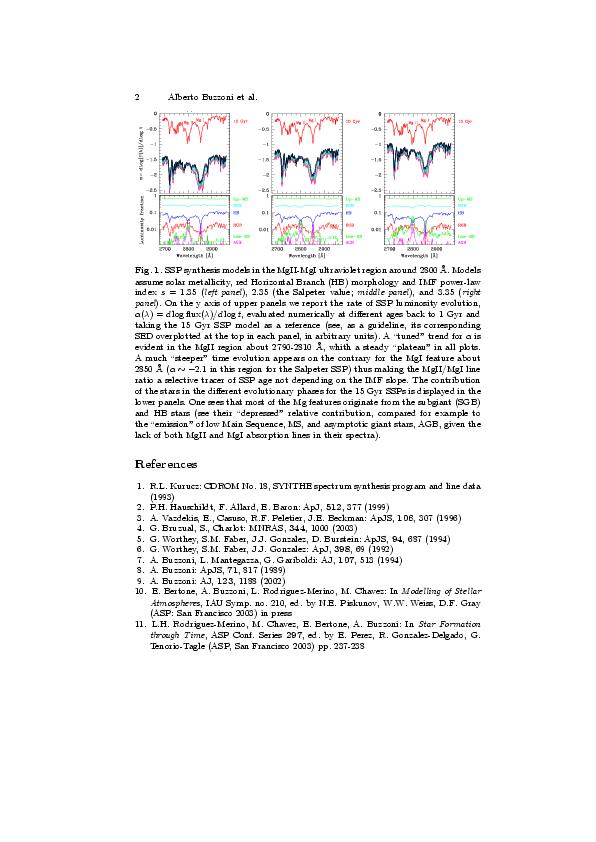
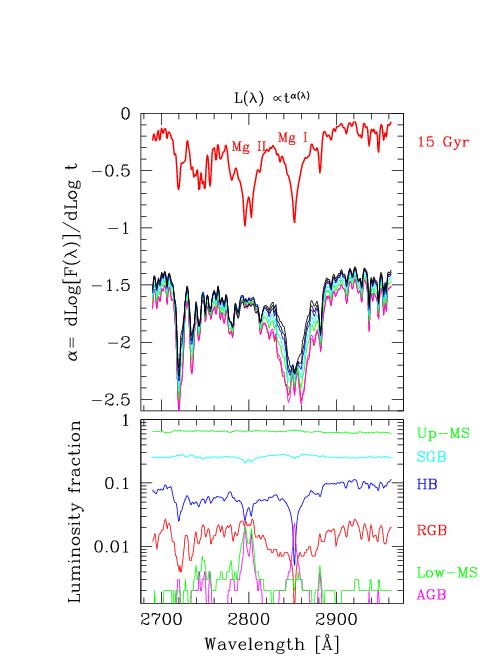
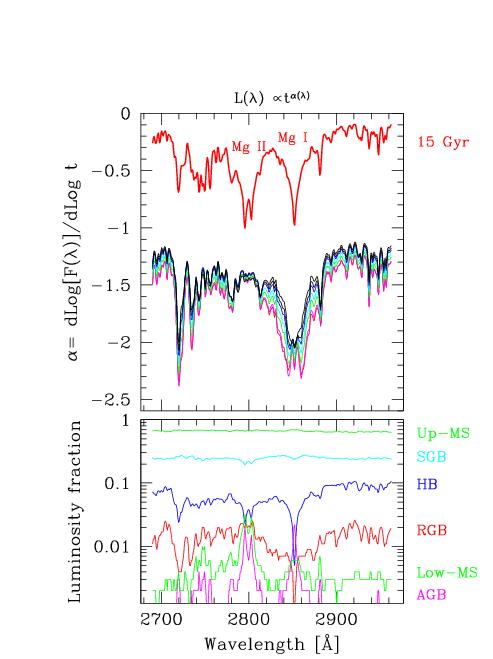
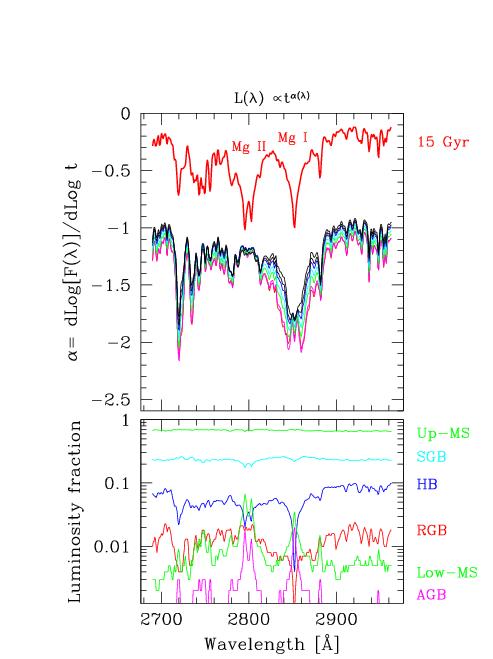
Fig. 1a,b,c: SSP synthesis models in the MgII-MgI ultraviolet region around 2800 Å.
Models assume solar metallicity, red Horizontal Branch (HB) morphology and
IMF power-law index s = 1.35 (left panel), 2.35 (the Salpeter
value; middle panel), and 3.35 (right panel).
On the y axis of upper panels we report the rate of SSP luminosity evolution,
α(λ) = d log flux(λ)/d log t, evaluated numerically at
different ages back to 1 Gyr and taking the 15 Gyr SSP model as a reference
(see, as a guideline, its corresponding SED overplotted at the top in each
panel, in arbitrary units). A "tuned" trend for α is evident in the MgII
region a bout 2790-2810 Å, whith a steady "plateau" in all plots.
A much "steeper" time evolution appears on the contrary for the MgI
feature about 2850 Å (α ~ -2.1 in this region for the Salpeter SSP)
thus making the MgII/MgI line ratio a selective tracer of SSP age not depending
on the IMF slope. The contribution of the stars in the different evolutionary
phases for the 15 Gyr SSPs is displayed in the lower panels. One sees that most
of the Mg features originate from the subgiant (SGB) and HB stars (see their
"depressed" relative contribution, compared for example to the "emission" of
low Main Sequence, MS, and asymptotic giant stars, AGB, given the lack of both
MgII and MgI absorption lines in their spectra).
|