Back to article listing
 |
Shortcut to the SSP models |
Back to article listing |
|
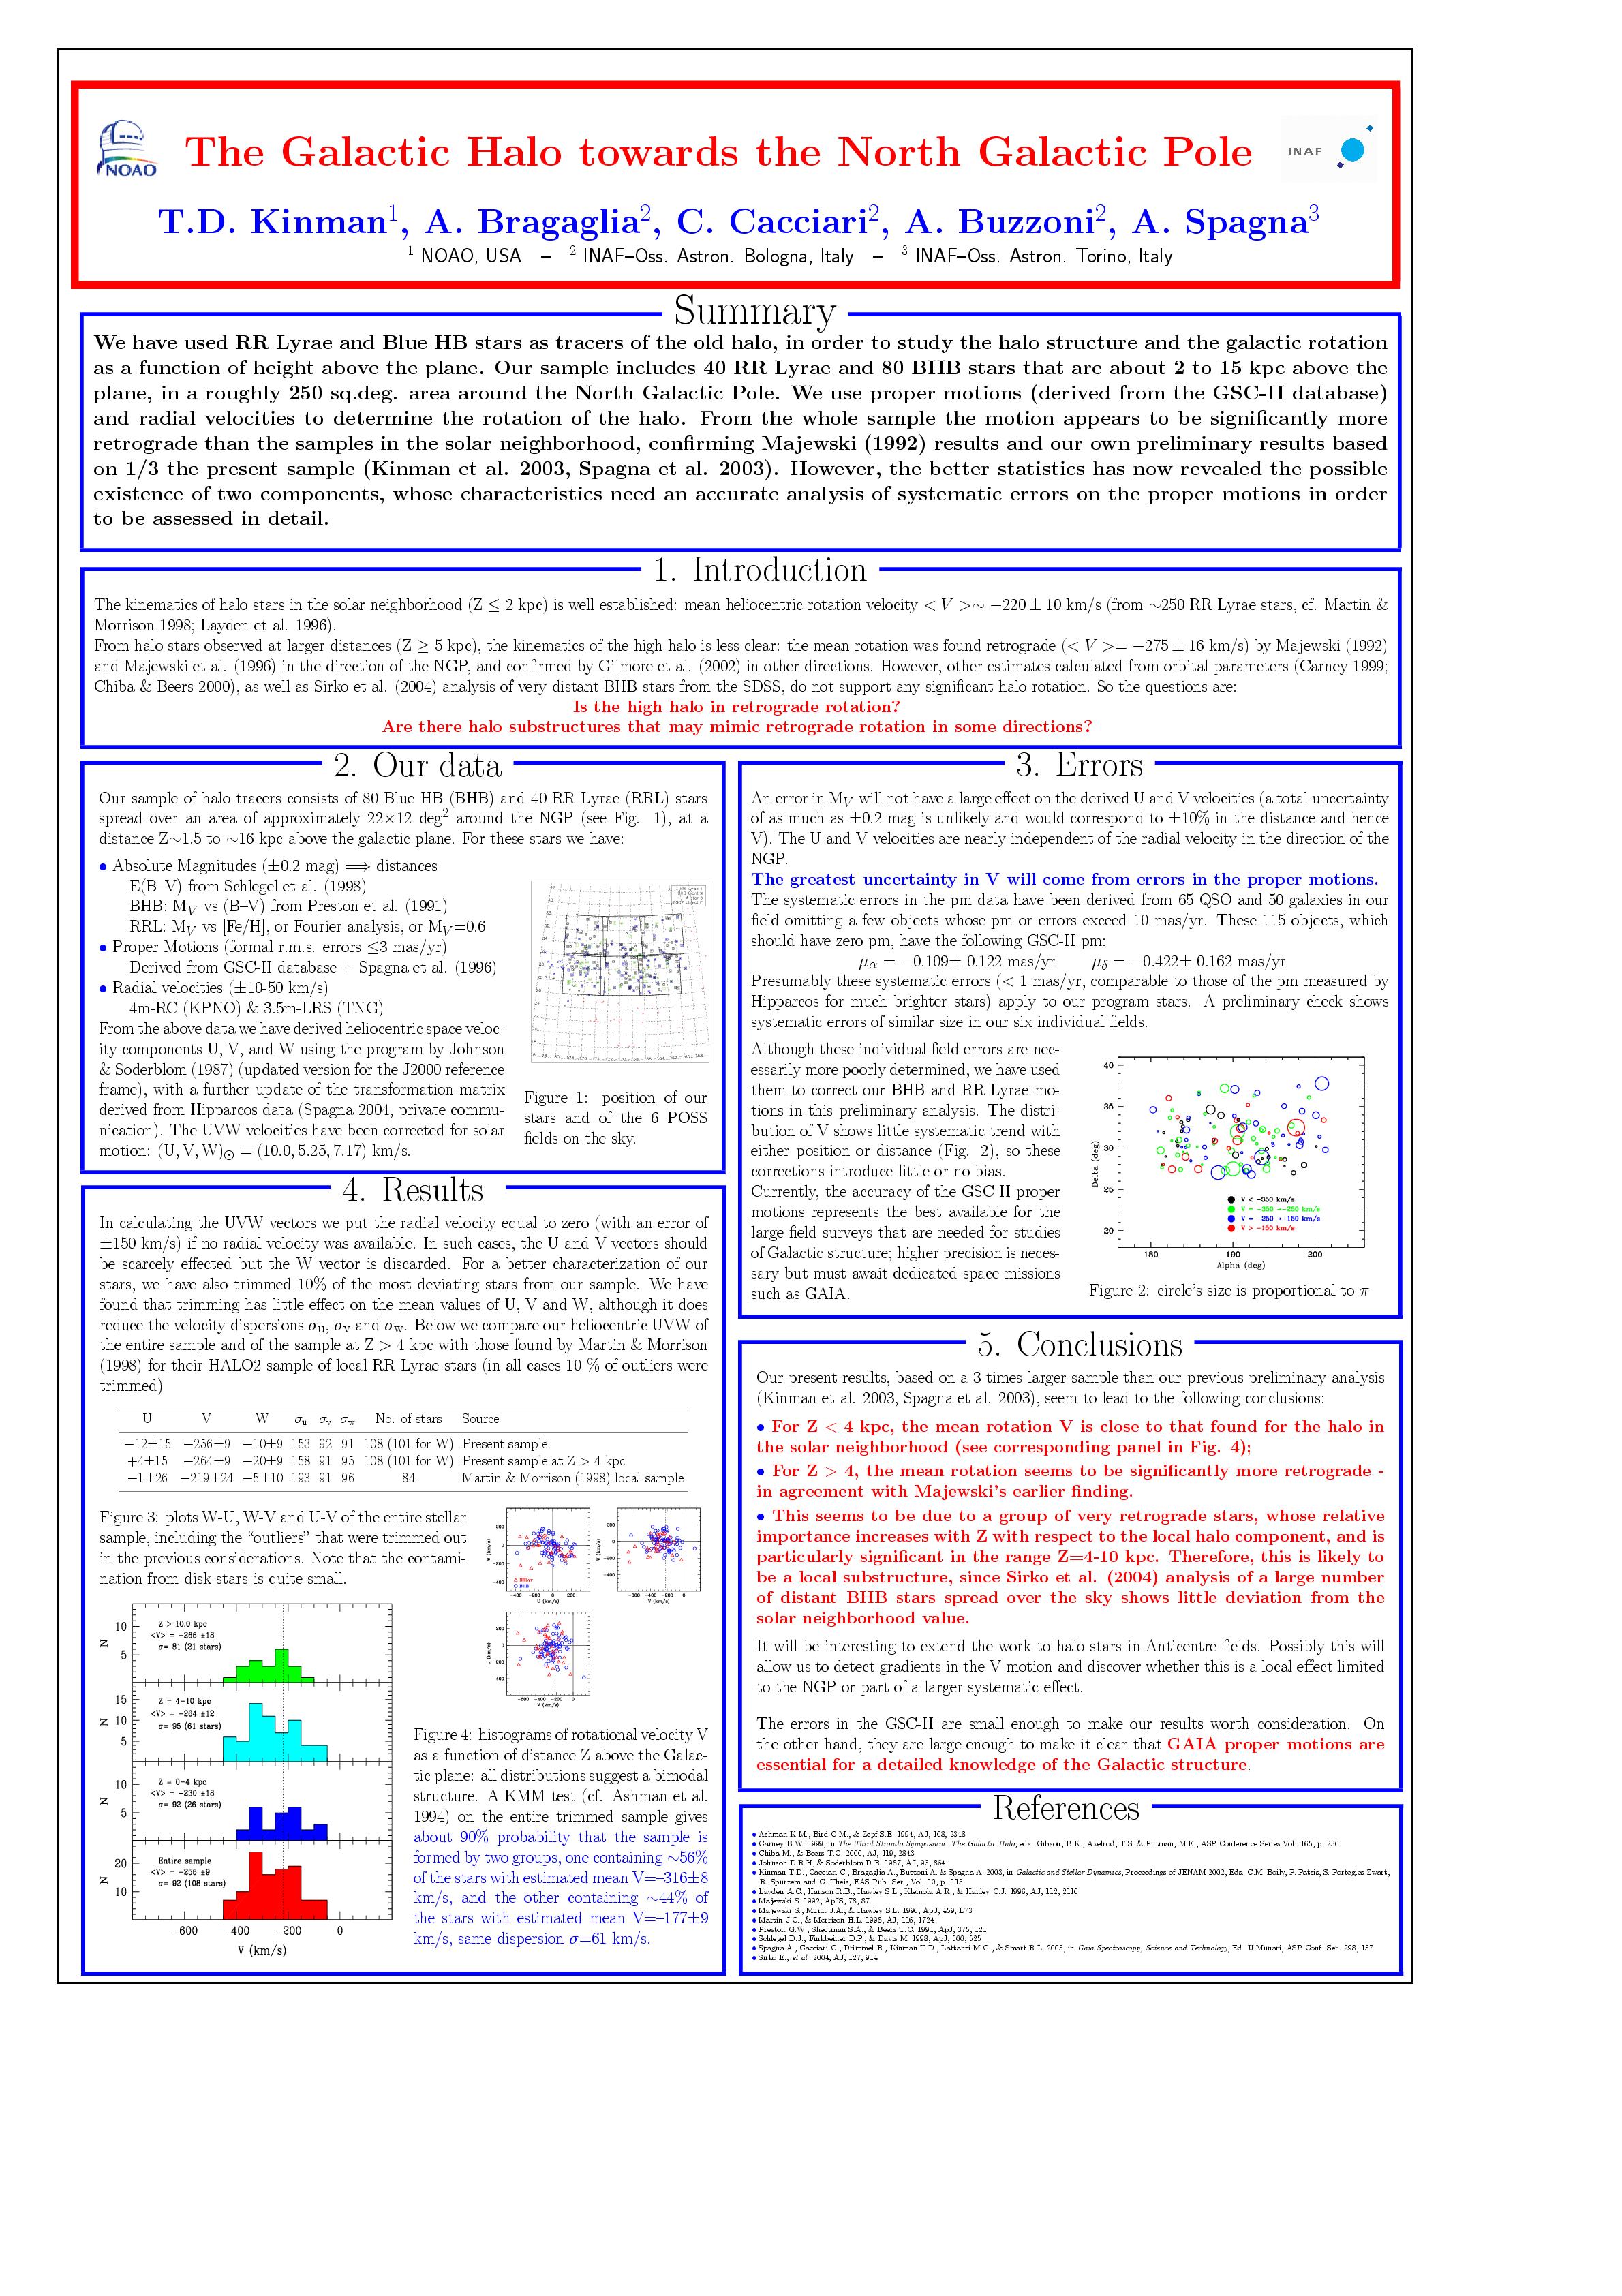
| Kinman, T.D., Bragaglia, A., Cacciari, A., Buzzoni, A., and Spagna, A.: "The Galactic halo towards the North Galactic Pole", 2005, proc. of "The Three Dimensional Universe with GAIA", ESA SP-576, eds. C. Turon, K.S. O'Flaherty and M.A.C. Perryman (ESA: Paris) p. 175 |
| Summary: |
|
We have used RR Lyrae and Blue HB stars as tracers of the old Galactic halo,
in order to study the halo structure and the galactic rotation as a function
of height above the plane. Our sample includes 40 RR Lyrae and 80 BHB stars
that are about 2 to 15 kpc above the plane, in a 22°x12° area
around the North Galactic Pole. We use proper motions (derived from the GSC-II
database) and radial velocities to determine the rotation of the halo.
From the whole sample the motion appears to be significantly more retrograde
than the samples in the solar neighborhood, confirming Majewski (1992)
results and our own preliminary results based on 1/3 the present sample.
However, the better statistics has now revealed the likely existence of two
components, whose characteristics need an accurate analysis of systematic
errors on the proper motions in order to be assessed in detail. To track back this project see also this page locally. |
 | |
| Click on the thumbnails to enlarge the figures and read the poster
at full resolution (2400x3400 px = 1.2Mb) | |
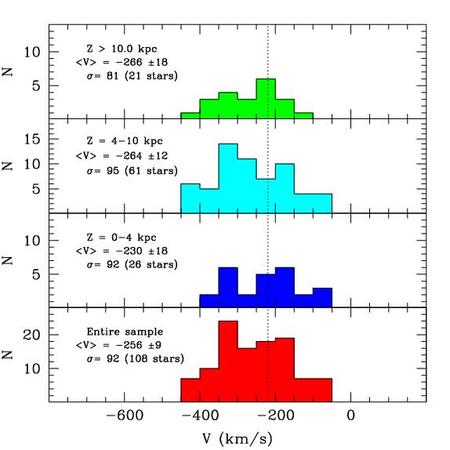
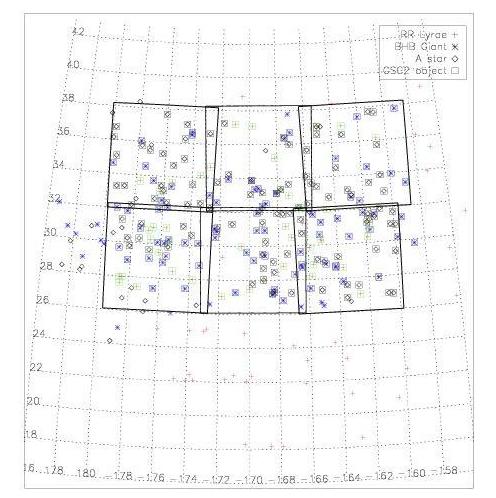 Fig. 1 - The POSS fields at the NGP where we have performed the present analysis. Right ascension, along the X axis, is expressed in arc degrees. 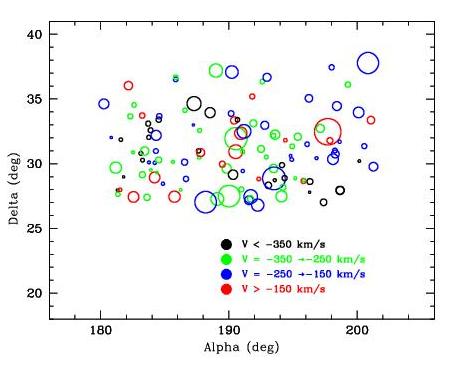 Fig. 2 - Rotational velocity V after correction for pm systematic errors in each field, as a function of position and distance. The color codes represent different V intervals, and the size of the symbol is proportional 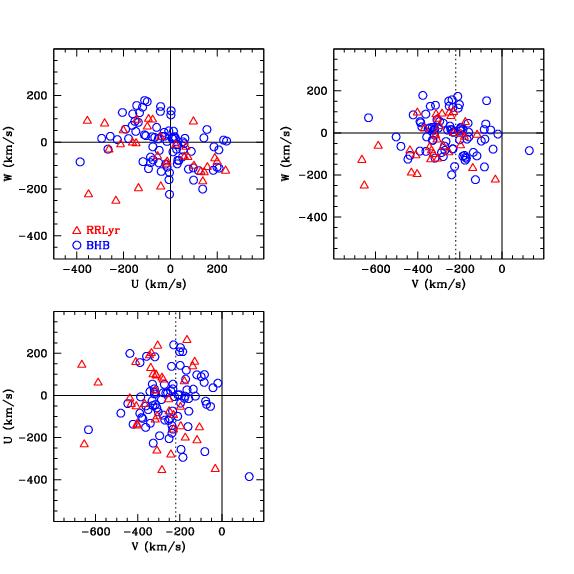 Fig. 3 - Plots W-U, W-V and U-V of the entire stellar sample, including the "outliers" that were trimmed out in the previous considerations. Triangles and circles represent RR Lyrae and BHB stars, respectively. The mean heliocentric rotation velocity 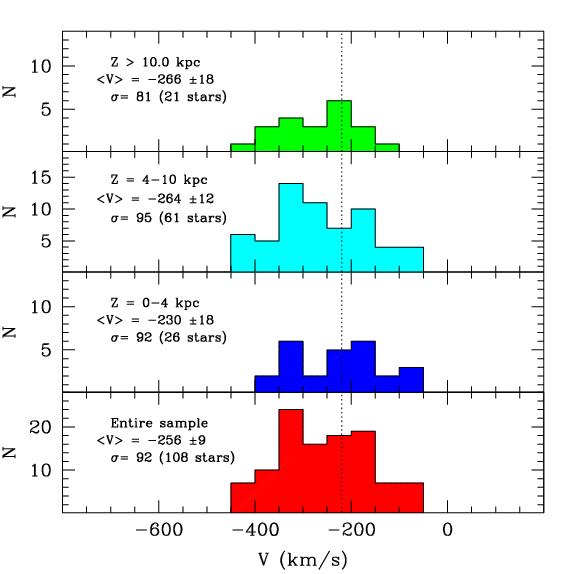 Fig. 4 - Histograms of rotational velocity V as a function of distance Z above the Galactic plane: all distributions suggest a bimodal structure. |
 |
Back to article listing |
|
| AB/May 2005 |
|
|