VVDS
Photometric Stellar Masses Working Group
Comparison between different Mass estimate
1- Photometric Mass (by MB) vs. Spectrophotometric Mass (by PF)in
VVDS sample:
Sample: VVDS
I-band subsample IAB < 24 & VVDS K-band subsample KAB <
22.75 )
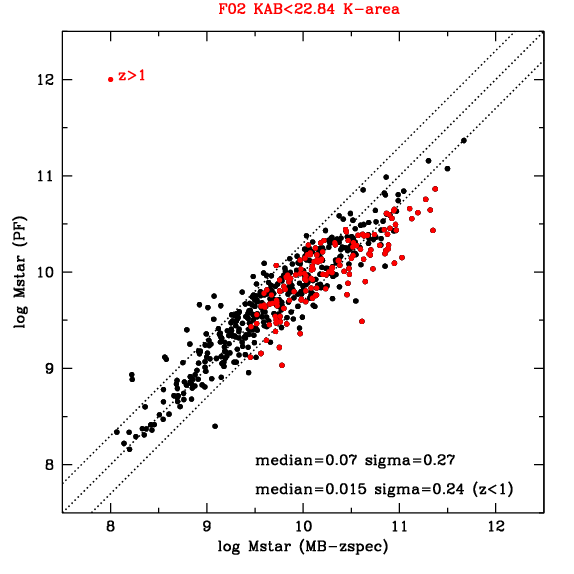
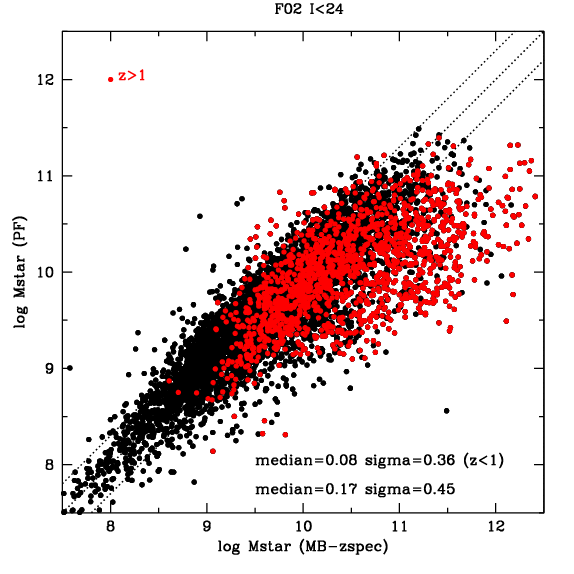
The overall agreement is quite good, in
particular at low redshifts: at z>1 photometric Masses (by MB) are sligthly
higher than spectrophotometric Masses (by PF). (Salpeter IMF used)
Work in progress to underestand the differences....
In particular we will check the different SFH used (exponential vs. Sandage),
different spectral synthesis models (Bruzual & Charlot vs. Pegase), different
treatments of metallicity (solar vs. evolving metallicity) and dust (Calzetti
vs. self-consistent model).
2- Spectral
vs. photo Mass (by FL) in VVDS sample:
(see also
here )
Sample: VVDS
I-band subsample IAB < 24
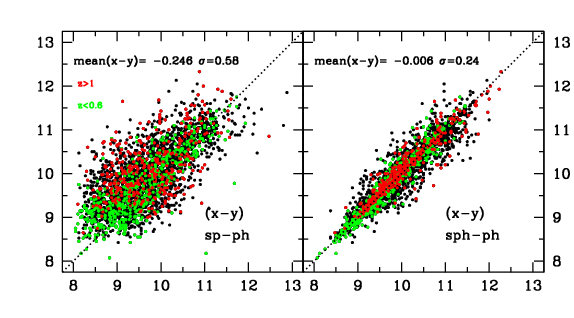
Left panel: Masses using only spectral
features (D4000 and Hdelta:sp in the plots) have a big dispersion
compared to Masses using only Photometric data (by FL: ph in the plots)
and a systematic shift of a factor ~1.8, independent of redshift.
Right panel: Masses adding spectral features
(D4000 and Hdelta) to photometric data (by FL: sph in the plots) are
in agreement with only photometric estimate (ph in the plots) with
a small (0.24 in log) dispersion. Comment by LP: Due to the higher number
of band in photometric data compared to spectroscopic features.
(Chabrier IMF used)
3- Spectral
+ photo Mass (by FL) vs. Photometric Mass (by MB)in VVDS sample:
(see also
here )
Sample: VVDS
I-band subsample IAB < 24
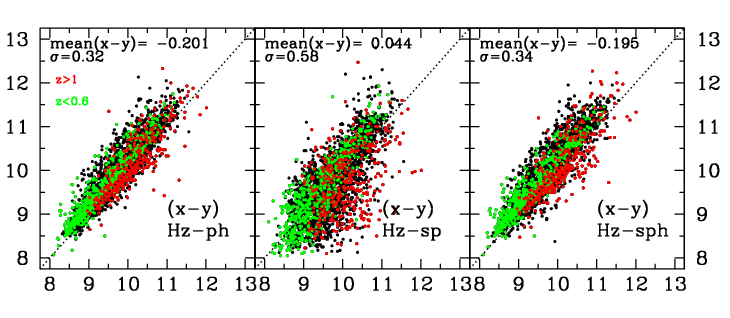
Left panel: Photometric Masses (using
HyperZ by MB: Hz in the plots) compared to Photometric Masses (by FL:
ph in the plots): systematic shift of a factor ~1.59 in particular
at low redshifts (z<0.6).
Middle panel: Photometric Masses (using
HyperZ by MB: Hz in the plots) compared to Spectral Masses (using D4000+Hdelta
by FL: sp in the plots): big dispersion (0.58 in log) between the
two methods, but overall not a general disagreement, but dependence on redshift.
Right panel: Photometric Masses (using
HyperZ by MB: Hz in the plots) compared to spectral+photo Masses (D4000
and Hdelta + photometry by FL: sph in the plots): systematic
shift of a factor ~1.57 in particular at low redshifts (z<0.6).
(Chabrier IMF used)
General comments: In particular we will check the different SFH
used (exponential vs. exponential+burst), same spectral synthesis models
(Bruzual & Charlot), BUT different treatments of metallicity (solar vs.
many metallicities) and dust (Calzetti vs. 2-component model). (In progress....)
4- Spectral
+ photo Mass (by FL) vs. SpectroPhotometric Mass (by PF) in VVDS sample:
Sample: VVDS
I-band subsample IAB < 24
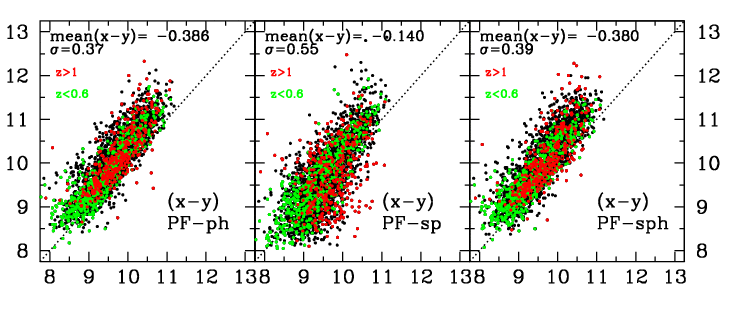
Left panel: SpectroPhotometric Masses
(by PF converted to Chabrier IMF using a 1.72 convertor factor: PF in
the plots) compared to Photometric Masses (by FL: ph in the plots):
systematic shift of a factor ~2.4 at all redshifts.
Middle panel: SpectroPhotometric Masses
(by PF converted to Chabrier IMF using a 1.72 convertor factor: PF
in the plots) compared to Spectral Masses (using D4000+Hdelta by FL:spin
the plots): big dispersion (0.55 in log) between the two methods, and a systematic
shift of a factor ~1.4 in particular at low redshift (z<0.6).
Right panel: SpectroPhotometric
Masses (by PF converted to Chabrier IMF using a 1.72 convertor factor: PF
in the plots) compared to spectral+photo Masses (D4000 and Hdelta + photometry
by FL: sph in the plots): systematic shift of a factor ~2.4
at all redshifts.
General comments: see above
last update: May 18, 2005 (by LP)


