Back to article listing

Back to article listing |
|
Shortcut to the SSP models |
| Fusi Pecci, F., Bellazzini, M., Buzzoni, A., De Simone, E., Federici, L., Galleti, S.: |
| "Massive young clusters in the disk of M31", |
| 2005, Astron. Journal, 130, 554. |
|
Summary:
We have studied the properties of a sample of 67 very blue and likely young
massive clusters in M31 extracted from the
Bologna
Revised Catalog of globular clusters, selected according to their color
[(B−V)o ≤ 0.45] and/or to the strength
of their Hβ spectral index (Hβ ≥ 3.5 Å).
Their existence in M31 has been noted by several authors in the past; we show
here that these Blue Luminous Compact Clusters (BLCCs) are a significant
fraction (> 15%) of the whole globular cluster system of M31.
Compared to the global properties of the M31 globular cluster system, they
appear to be intrinsically fainter, morphologically less concentrated, and
with a shallower Balmer jump and enhanced Hβ absorption in their spectra.
Empirical comparison with integrated properties of clusters with known age as
well as with theoretical SSP models consistently indicate that their typical
age is less than ~2 Gyr, while they probably are not so metal-poor as
deduced if considered to be old. Either selecting BLCCs by their (B−V)o
colors or by the strength of their Hβ index the cluster sample turns out
to be distributed onto the outskirts of M31 disc, sharing the kinematical
properties of the thin, rapidly rotating disc component.
If confirmed to be young and not metal-poor, these clusters indicate the
occurrence of a significant recent star formation in the thin disc of M31,
although they do not set constraints on the epoch of its early formation.
| ||
|
| Pick up the paper at Astro-ph/0503188 | Local gzipped Postscript version (313Kb) | ||
| HTML version at the AJ site (*) | PDF file at the AJ site (*) | ||
| (*) Requires access password |
| ||
| ||
|
| (**) For cluster coordinates and further information please refer to the Bologna Revised Catalog of M31 Globular Clusters |
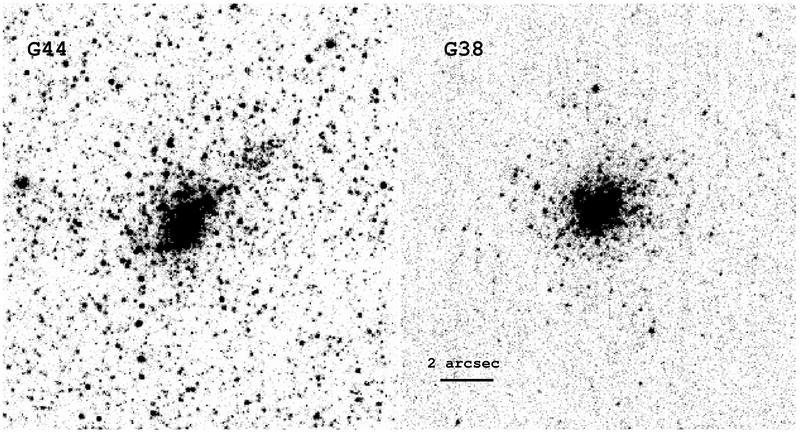 |
Fig. 1 - The BLCCs G38 and G44 from the HST-WFPC2 observations by
Williams & Hodge (2001a). Frames have been retrived from the
WFPC2 associations archive.
|
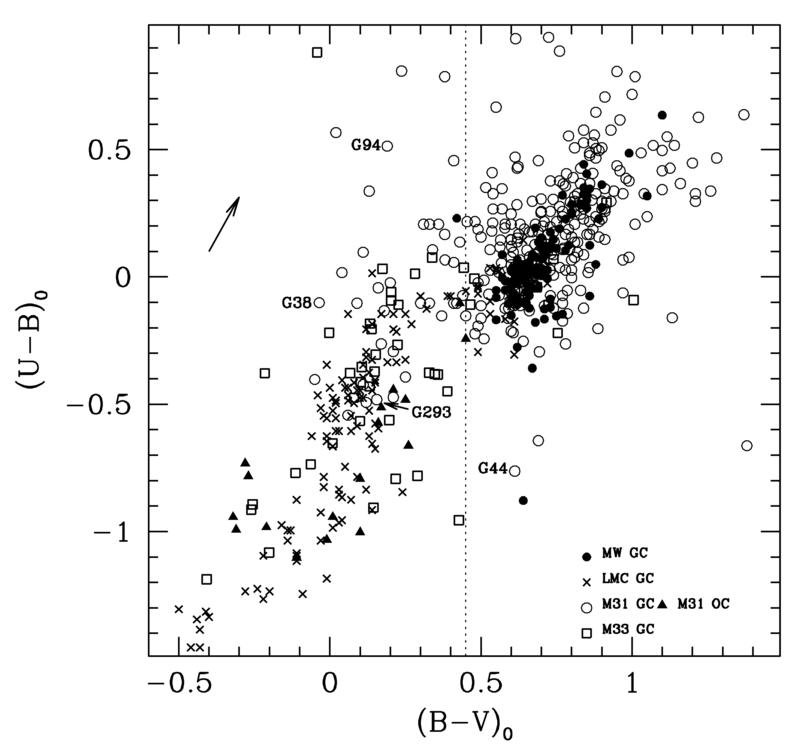 |
Fig. 2 - Two-color diagram of globular clusters for Local Group galaxies.
Data for M31 globulars are from the Bologna Revised Catalog (Gallet et al. 2004; open dots), those for the
Milky Way are from Harris (1996; solid dots), LMC GCs are from Van den Bergh (1981; crosses)
and M33 data are from Chandar et al. (1999; squares). Also reported in the plot are the
M31 open clusters from the Hodge (1979) catalog (solid triangles).
All the data have been reddening-corrected assuming E(B-V) = 0.11 for M31,
0.13 for LMC and 0.07 for M33. MW globulars have been
corrected according to Harris (1996).
Note the broader color distribution of M31 GCs compared to the MW population.
Vertical line marks the reference value (B−V)o = 0.45, adopted for BLCC selection.
Labeled clusters are those observed by Williams & Hodge (2001a) with HST.
The arrow is a reddening vector for E(B−V) = 0.1 mag.
|
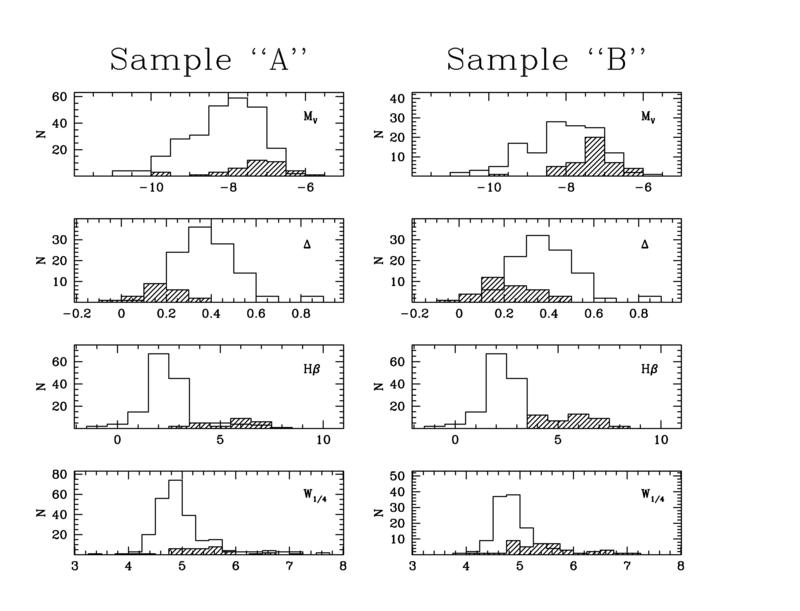 |
Fig. 3 - Left panels, from top to bottom -
Distribution of color-selected BLCCs (Sample "A"; shaded histograms) and "ordinary" clusters
with (B−V)o > 0.45 (clean histograms) vs. absolute V
magnitude, the 4000 Å Balmer-break index Δ (in magnitude scale, according to Brodie & Hanes 1986),
the Lick Hβ pseudo-equivalent width (in Å, according to Faber et al. 1985),
and W1/4 morphological parameter (according to Buonanno et al. 1982, and Battistini et al. 1987).
Right panels, from top to bottom - Same as the left panels,
but for the Hβ-selected BLCCs (Sample "B"; shaded histograms) vs. "ordinary" clusters,
now defined as those with Hβ>3.5 Å (clean histograms).
|
|
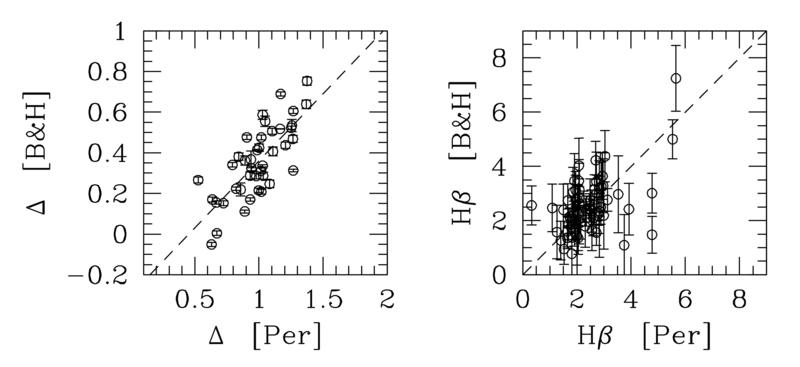
Fig. 4 - Standard calibration for the Brodie & Hanes (1986) Δ and Lick Hβ indices.
Data for 41 M31 globular clusters of Perrett et al. (2002), in common with Brodie & Huchra (1990)
are compared, and the least-square equations of transformation are derived, as labeled
in the plots. Note that the Perrett et al. (2002) Hβ index has been converted to
pseudo-equivalent width, in Å, while the 4000 Å Balmer jump index, Δ, is
expressed in magnitudes.
|
|
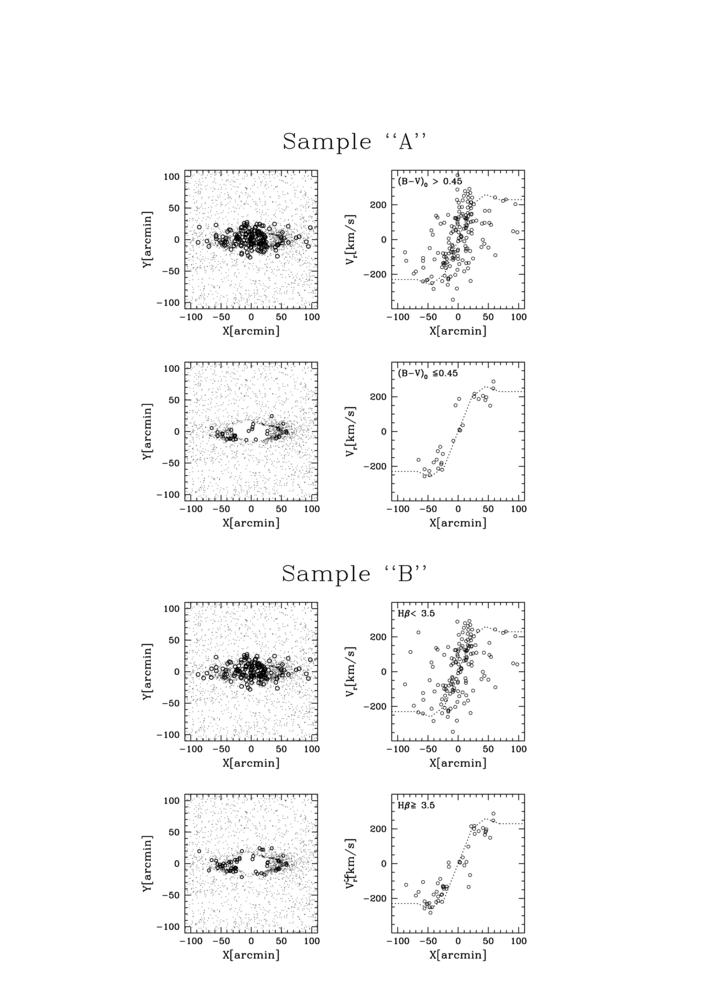
Fig. 5 - Spatial distribution and kinematic properties of M31 "ordinary"" globular
clusters, with (B−V)o > 0.45 or Hβ < 3.5 Å,
as labeled (upper plots in each panel), compared
with the BLCCs of Sample "A" and "B" (lower plots in each panel).
The smoothed disc structure in the M31 maps is traced by the PSC-2MASS sources Cutri et al. 2003),
mainly consisting of bright AGB members and Carbon stars. Overplotted on the radial velocity
distribution, as a function of the major axis displacement X, is the rotation curve of M31
disc according to van den Bergh (1981).
|
|
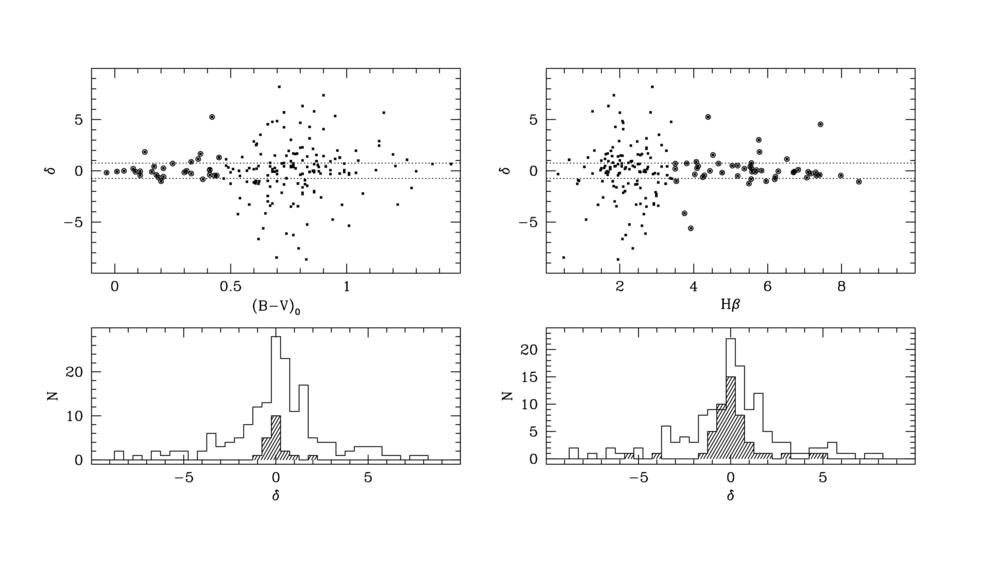
Fig. 6 - GC kinematic residuals, δ, with respect to
the Morrison et al. (2004) disc model for M31. The BLCCs distribution, according
to Sample "A" (upper left panel) and "B"
(upper right panel) is marked on the plots (big solid dots)
compared to the remaining fraction of "ordinary" clusters (small points).
The dotted strip encloses the low-residual region with |δ < 0.75 (such
low-δ clusters basically share the disc kinematic, according to Morrison's et al. model).
The histogram of the δ distribution for each plot is also summarized in
the lower panels for BLCCs (shaded) and "ordinary" GCs (open histograms).
|
|
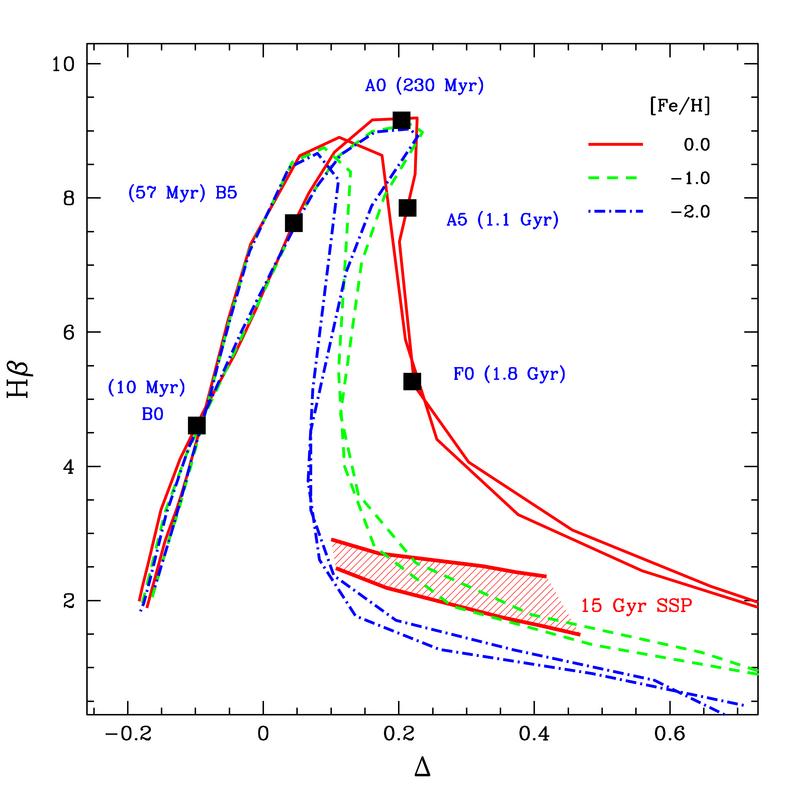
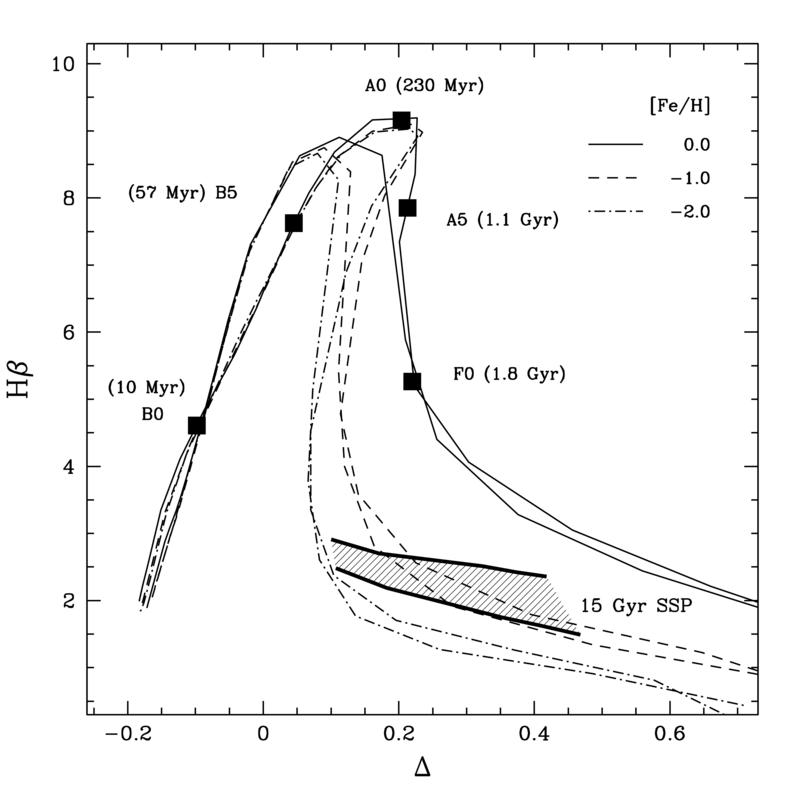
Fig. 7 - Theoretical diagram for the Hβ Lick index (in Å vs. Balmer jump
Δ index (in magnitude scale).
Thin curves are the expected locus for MK V stars of different temperature, from 5000 to 50000 K,
surface gravity (log g = 4 and 5, the latter being the shelf of curves peaking at slightly
higher values of Hβ), and metallicity (from [Fe/H] = −2 to solar, as labeled).
Theoretical indices rely on the Bluered
library of synthetic stellar spectra (Bertone et al. 2001; Bertone et al. (2003).
The empirical spectral-type vs. effective temperature calibration of Johnson (1966)
is marked on the (log g, [Fe/H]) = (5, 0.0) curve, together with the estimated main sequence
lifetime of stars, as derived from Buzzoni (2002).
The shaded strip is the region for the 15 Gyr SSP models of
Buzzoni (1989), with different
HB morphology. Lower edge in the strip is for a red-clump HB morphology, while upper edge
is for a blue HB. SSP metallicity spans the range [Fe/H] = −2.27 to +0.22 dex, in the
sense of increasing Δ.
|

|
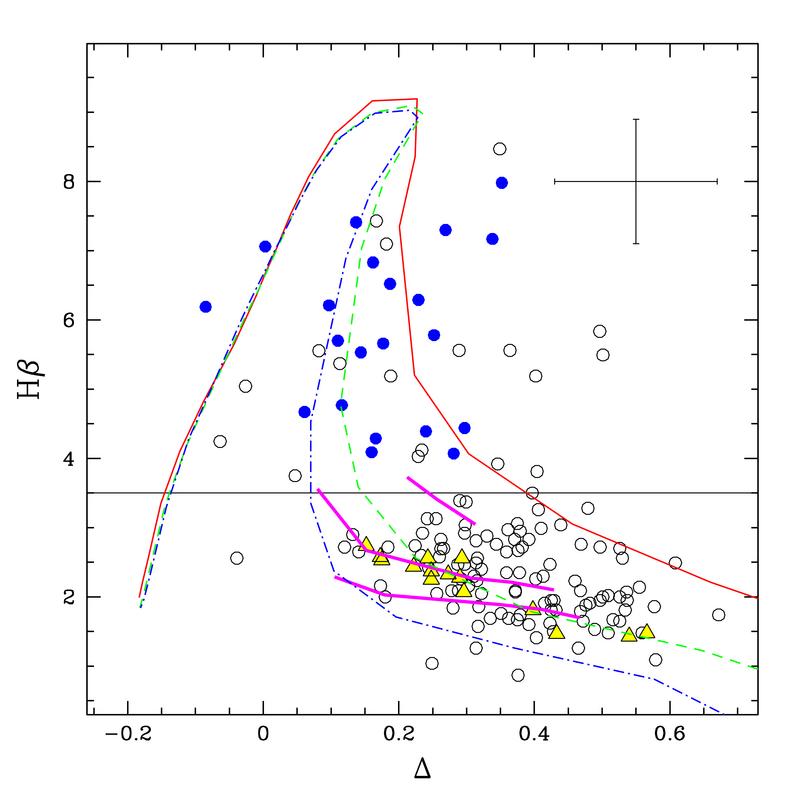
Fig. 8 - The M31 GC distribution in the Hβ vs. Δ index plane. Reference curves
for log g = 5 stars of different temperature (from 5000 to 50000 K) and metallicity
([Fe/H] from −2 to solar) are reported from Fig. 7. Sample "A" (i.e. color-selected)
BLCCs are singled out (solid dots). By definition, Sample "B" comprises all the targets in the plot
above the Hβ = 3.5 Å threshold, as marked (40 objects with available indices
from Table 1). For comparison, solid triangles are
the Brodie & Huchra (1990) data for MW GCs, while thick solid lines are the locus for the
Buzzoni (1989) SSP models
with t = 15, 8 and 2 Gyr (in the sense of increasing Hβ), red HB morphology, and
metallicity [Fe/H] = −2.27 to +0.22. Typical error bars for M31 data are reported top left.
|
|
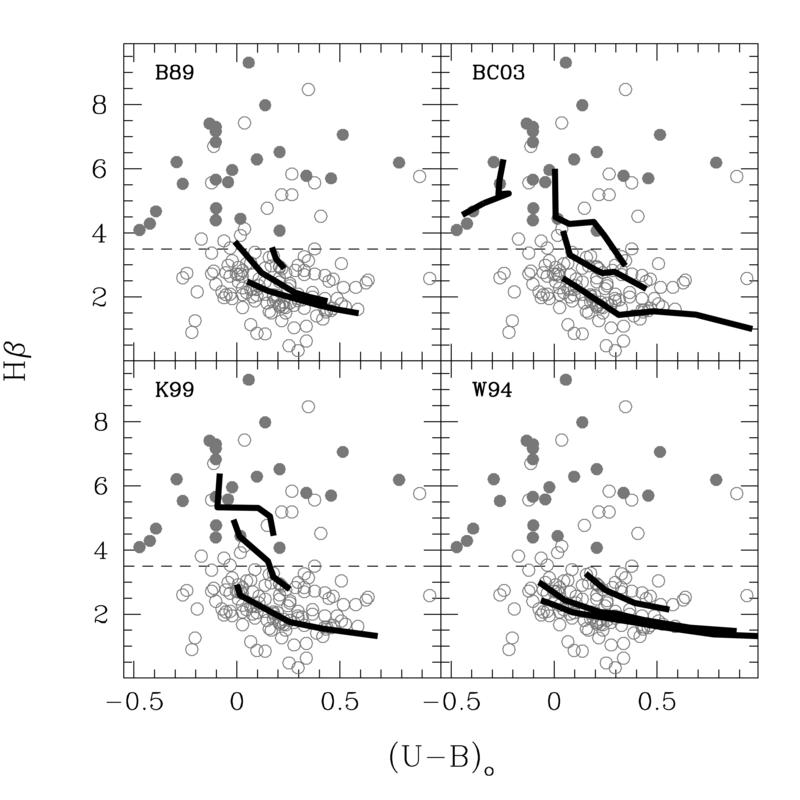
Fig. 9 - The M31 GC distribution in the Hβ vs. (dereddened) U−B index plane.
Like in Fig. 8, Sample "A" BLCCs are singled out by solid dots while, by definition,
Sample "B" comprises all the objects with Hβ > 3.5 Å.
The four panels report a comparison with SSP models from different population synthesis codes,
according to
Buzzoni (1989)
(B89, upper left panel, for t = 15, 8 and 2 Gyr),
Bruzual & Charlot (2003) (BC03, upper right, for t = 15,
2, 1 and 0.1 Gyr), Kurth et al. (1999) (K99, lower left,
for t = 15, 2 and 1 Gyr), and Worthey (1994) (W94,
lower right panel, for t = 12, 8 and 2 Gyr).
In all cases, synthetic Hβ index increases with age (excepting the 100 Myr model
of Bruzual & Charlot (2003), with a negative U−B and a "fading" Hβ index, recalling the
trend of Fig. 7.
|
|
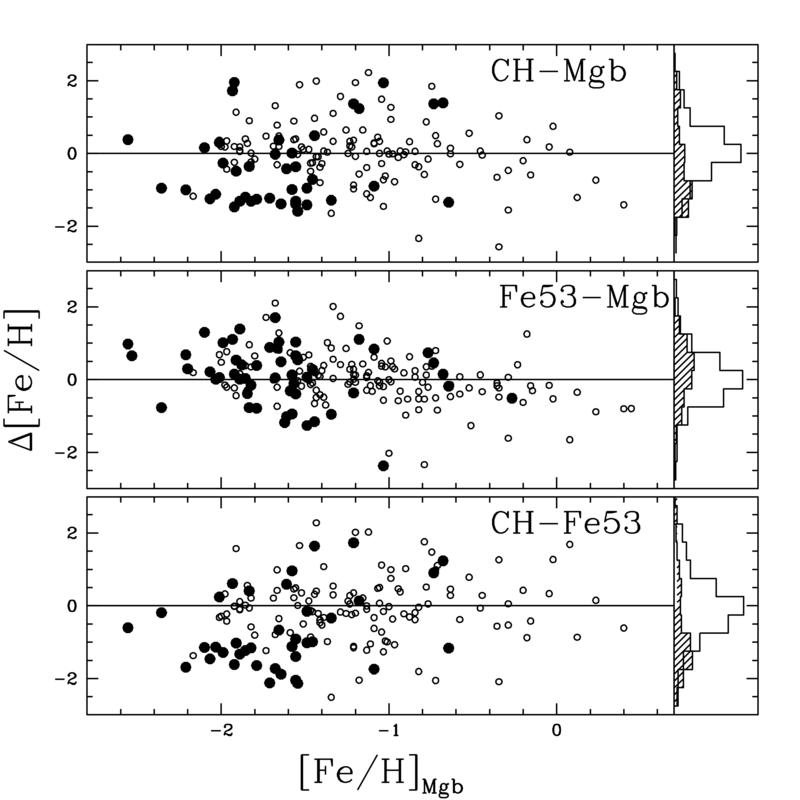
Fig. 10 - Metallicity estimates from single Lick spectrophotometric indices for M31 GCs
according to Perrett et al. (2002). Reported are the differences in the inferred value of
[Fe/H] for each individual cluster from the empirical calibration of the CH (G band), Mgb
and Fe5335 indices. Sample "B" BLCCs are singled out by big solid dots, while
Δ[Fe/H] residual distribution is summarized by the vertical histograms on the right
(shaded curve for BLCC distribution and clean histogram for the remaining GC population).
For BLCCs it is evident a systematic bias on the average estimate of [Fe/H]
(reported in Table 1) induced by the exceedingly metal-poor abundance
inferred by the G band (Δ[Fe/H] ~ −1 dex, cf. upper and lower panels
in the figure). Both Mgb and Fe5335 metallicity values are on the contrary fully self-consistent,
in average (cf. middle panel).
|
|
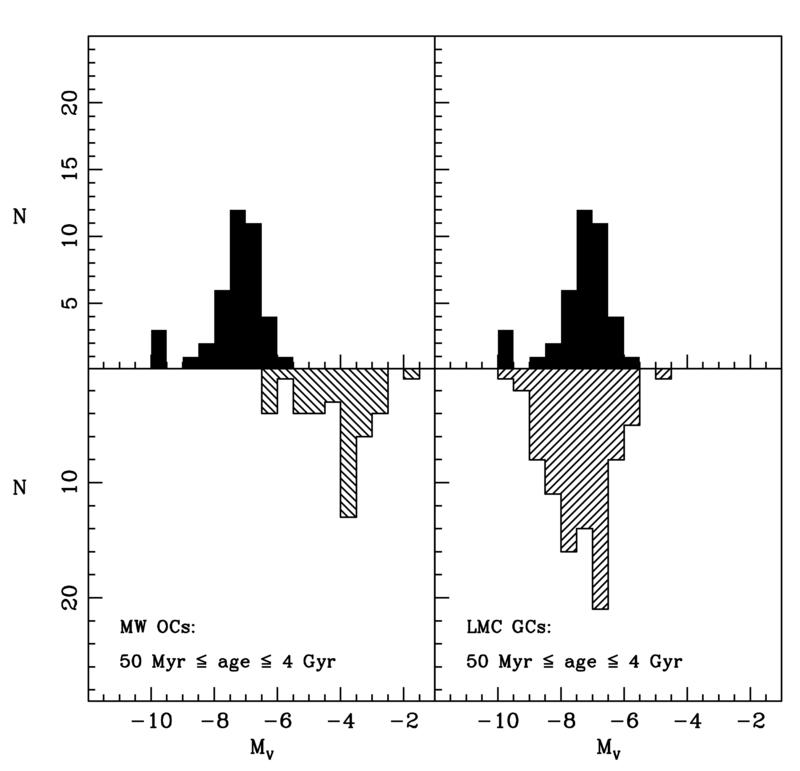
Fig. 11 - Comparison of the Luminosity Function (LF) of M31 BLCCs (filled
histogram, upper panels) with: (left panel) the LF of the
Open Clusters (OC) of the Milky Way in the same age range; (right panel)
the LF of LMC globular clusters in the same age range.
|
|
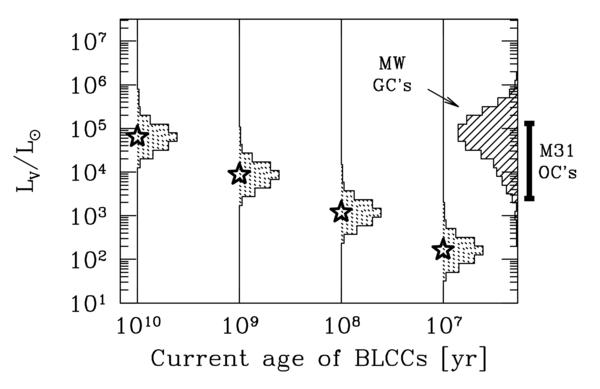
Fig. 12 - The effect of evolution on BLCC luminosity.
The dotted histograms trace the expected BLCCs luminosity function
as predicted at t = 10 Gyr, according to different values assumed
for the current typical age of these objects (as labeled on the x axis).
We assume a SSP evolution, according to
Buzzoni's (1989) synthesis
models, for a Salpeter IMF and a (roughly) solar metallicity.
For comparison, the observed luminosity distribution of MW GCs is
reported on the right vertical axis, derived from Harris (1996)
(hatched histogram), while the indicative luminosity range for
M31 open clusters is also sketched (thick solid bar on the right)
according to Hodge (1979).
|
Back to article listing |
|
Shortcut to the SSP models |
| AB/Jul 2005 |
|
|