| Table 1 - SSP ultraviolet evolution at 1600, 2000, and 2800 Å, for a Salpeter IMF with upper cutoff mass of 120 M_sun. | (ASCII) (Gif) |
|
| Table 2 - The log φ calibration for star-forming galaxies. The listed quantity is log L_min at 1600, 2000,
and 2800 Å, in erg/sec/Hz according to eq. (6) for a SFR = 1 M_sun/yr | (ASCII) (Gif) |
|
| Table 3 - Distinctive parameters of template galaxies of different Hubble Types for 15 Gyr synthesis models | (ASCII) (Gif) |
|
| Table 4 - UV luminosity evolution of E galaxies | (ASCII) (Gif) |
|
| Table 5 - UV luminosity evolution of Sa galaxies | (ASCII) (Gif) |
|
| Table 6 - UV luminosity evolution of Sb galaxies | (ASCII) (Gif) |
|
| Table 7 - UV luminosity evolution of Sc galaxies | (ASCII) (Gif) |
|
| Table 8 - UV luminosity evolution of Sd galaxies | (ASCII) (Gif) |
|
| Table 9 - UV luminosity evolution of Im galaxies | (ASCII) (Gif) |
|
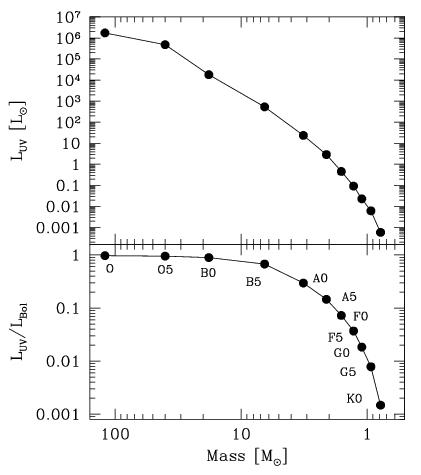
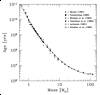
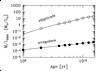
| Figure 1 -
UV Luminosity-Mass relation for MS stars (MK class V). The upper panel reports the emission for
λ < 3000 Å, in bolometric solar unit. The relative fraction of ultraviolet
to bolometric is displayed in the lower panel. Kurucz' (1992) model
atmospheres have been used to compute synthetic spectra. The calibration for the
120 M_sun star is from Bressan et al. (1993).
|

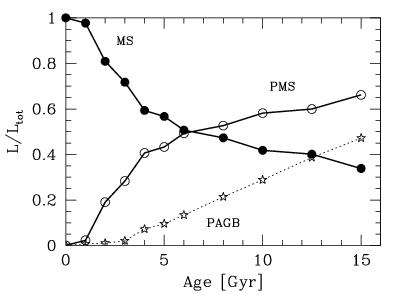
| Figure 2 -
The SSP luminosity evolution in the UV wavelength range (λ < 3000 Å)
according to Buzzoni's (1989) synthesis code. A solar metallicity and a Salpeter IMF
are assumed.
The relative contribution from MS (solid dots) and Post-MS (open dots) stars is compared.
The luminosity fraction provided by Post-AGB stars alone (stars) is also singled out.
|
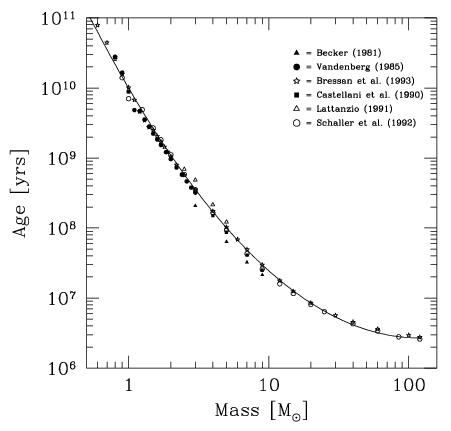
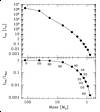
| Figure 3 -
Theoretical MS lifetime vs. stellar mass for Z_sun according to the evolutionary
tracks by Becker (1981), Vandenberg (1985), Castellani et al. (1990), Lattanzio (1991),
Schaller et al. (1992), and Bressan et al. (1993). The solid line is a fit to
the data according to eq. (3).
|

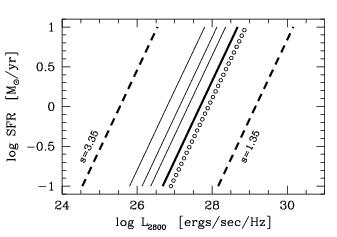
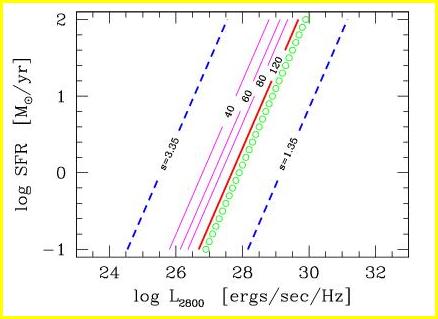
| Figure 4 -
Theoretical L_uv vs. SFR calibration at 2800 A according to eq. (6).
Solid lines (from the left to the right) refer to a Salpeter IMF (s = 2.35) and M_up
= 40, 60, 80, and 120 M_sun, with the last case marked in boldface.
The IMF slopes for s = 3.35 and 1.35 and M_up = 120 M_sun are explored by the
two dashed lines. The Madau et al. (1998) calibration for a Salpeter IMF and
M_up = 125 M_sun is also reported for comparison (dotted line).
|
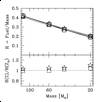
| Figure 5 -
Upper panel: The fraction of (initial) stellar mass consumed during MS evolution
according to the Padova (Bressan et al. 1993; Fagotto et al. 1994)
and Geneva (Schaller et al. 1992) evolutionary tracks.
The plotted quantity is R = Fuel/Mass where Fuel = (L_zams x t_ms)/(0.007 c^2)
converted to Hydrogen-equivalent solar masses.
Padova tracks are for Z_sun (triangles) and Z = 0.004 (stars)
while Geneva tracks are for Z_sun (open dots) and Z = 0.001 (squares).
Lower panel: The relative change in MS fuel consumption for the Padova
Z = 0.004 tracks with respect to the solar case (stars) and, similarly, for the
Geneva Z = 0.001 tracks (squares).
|
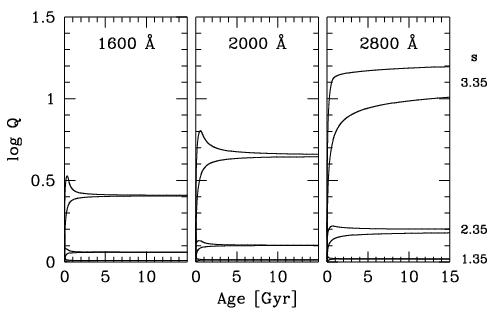
| Figure 6 -
The Q residual luminosity from the bulk of unevolved stars,
after eq. (8) for different IMF power-law slopes
with s = 1.35, 2.35, and 3.35, as labelled on the plots.
Each set of curves provides the envelope for a SFR = k t^(-η)
assuming η in the range +0.8 (upper envelope) and -0.8 (lower envelope). An
upper IMF cutoff mass of 120 M_sun is adopted.
|
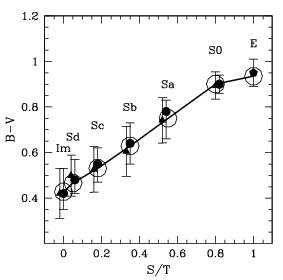
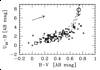
| Figure 7 -
Theoretical colors for template galaxies of different morphological type, according to
Table 3 (big open dots), compared with the mean B−V locus from Roberts and
Haynes (1994) (solid dots) and Buta et al. (1994) (solid triangles). Present-day galaxies
are assumed to be 15 Gyr old. Data for ellipticals are from Buzzoni (1995).
|
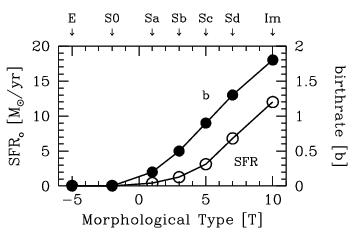
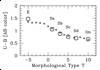
| Figure 8 -
Current SFR for disk stellar populations as expected from our
template models for different morphological types (left scale referring to open dots
in the plot). A total mass of 1E11 M_sun is assumed for the galaxies.
Right scale reports the mean birthrate b = SFR/< SFR > according to
Table 3 (solid dots).
|
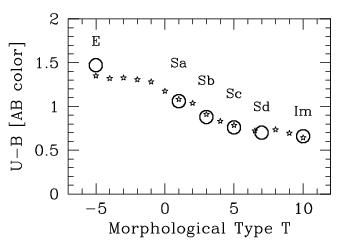
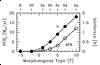
| Figure 9 -
Mean observed locus for RC3 galaxies of different morphological type
(stars) according to Buta et al. (1994) compared with 15 Gyr galaxy templates
(big open dots). The Johnson U−B color is in AB mag scale. Data have been
originally corrected for Galaxy and internal average reddening. The typical internal
scatter of the observed points is ± 0.1 mag.
|
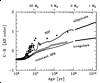
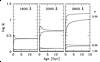
| Figure 10 -
Theoretical U−B colors (in AB mag scale) for primeval galaxies with continuous star
formation ("bluer" models) and SSP evolution ("redder" models). Models with Z_sun and
Salpeter IMF from Leitherer and Heckman (1995) (open and solid dots), and Leitherer et
al. (1999) (thin solid lines) are compared with our reference templates for E and Im galaxies
(thick solid lines, for t ≥ 1 Gyr). The SSP evolution consistently matches
early-type systems at later epochs while a constant SFR suitably describes late-type and
irregular galaxies. The SSP TO stellar mass at different epochs is reported on the top scale,
according to eq. (3).
|
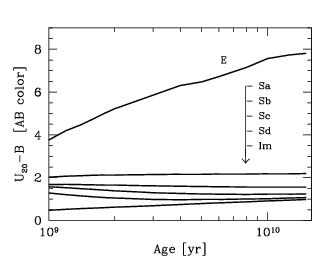
| Figure 11 -
Theoretical restframe evolution of the (U_20−B) AB color for model galaxies of
different morphological type.
|
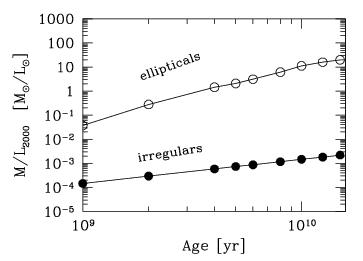
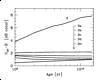
| Figure 12 -
Expected evolution of the galaxy M/L ratio at 2000 Å for the model ellipticals and
irregulars, according to the data in Table 4 and 9, respectively. Both mass and luminosity are in
solar unit. A solar reference luminosity L_sun = 2.39E15 erg/sec/Hz
is assumed at 2000 A from the Kurucz (1992) model atmospheres.
|
| Figure 13 -
Two-color diagram of the 149 late-type galaxies in the Donas et al. (1987)
sample (stars).
Big open dots markers report the locus for 15 Gyr template galaxies
along the sequence Im--E, in the sense of increasing B−V.
The Im model at 1 Gyr is also displayed (big squares).
Reference models assume a Salpeter IMF with M_up = 120 M_sun.
The effect of residual star formation in the early-type templates is indicated
by the vertical arrow on the E model.
A change in the IMF upper cutoff mass for M_up to 80 and 60 M_sun, in the sense
of "reddening" (U_20−B), is explored by the
dashed curves. All the colors in the plot are in AB mag scale. Galaxy reddening
is accounted for in the original observations. Reddening vector top left is from
Seaton (1979). The typical error bar for the UV data is ± 0.5 mag on U_20−B.
|
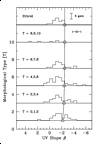
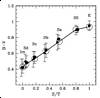
| Figure 14 -
Observed distribution of the UV spectral slope, β = Δ
log L (λ)/Δ log λ,
for 19 starburst galaxies from Gordon et al. (1997) (upper panel) and 93 spirals and irregulars
(T ≥ 0) from the IUE catalog of Rifatto et al. (1995). The latter sample has been grouped
in five bins according to the morphological parameter T, as labelled in the different panels.
Only the Gordon et al. data have been originally corrected for Galaxy reddening. Open dots and
the solid line mark the theoretical lower limit to β according to our 15 Gyr template
models (i.e. β = -2.4).
The reddening vector is Δ β/ E(B-V) = 3.1 according to Seaton (1979), while internal
attenuation is Δ β/ E(B-V) = 4.5 following Calzetti (1999). The typical uncertainty
in the observed UV slope is σ(β) ~ ± 0.7, for Rifatto et al. (as displayed
top right in the plot) and σ(β) ~ ± 0.25 for the Gordon et al. galaxies.
|