| Table 1 - SSP magnitude fitting functions | (Jpeg) |
|
| Table 2 - Input distinctive parameters for 15 Gyr models | (Jpeg) |
|
| Table 3 - Output summary for template galaxy models at 1 and 15 Gyr | (Jpeg) |
|
| Table 4 - Theoretical SN(II+Ibc) and Hypernova rates for late-type galaxies at present time | (Jpeg) |
|
| Table 5 - Balmer-line intensities for late-type galaxy templates (1 → 15 Gyr) | (ASCII) (Jpeg) |
|
|
|
|
|
|
|
|
|
|
|
|
|
|
|
 |
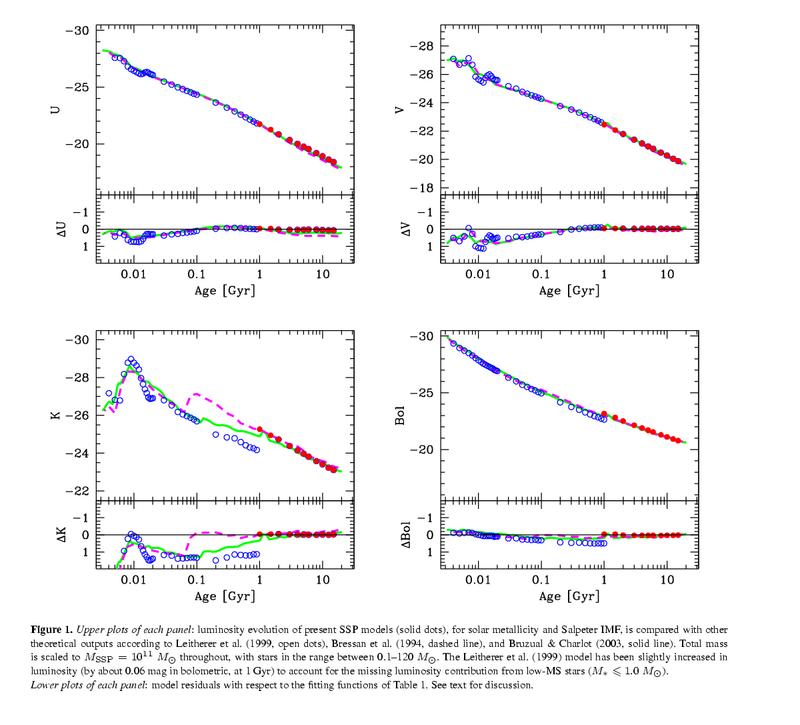
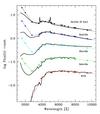
Fig. 1 - Upper plots of each panel: luminosity evolution of present SSP models
(solid dots), for solar metallicity and Salpeter IMF, is compared with other
theoretical outputs according to Leitherer et al. (1999; open dots), Bressan et al. (1994; dashed line),
Bruzual and Charlot (2003; solid line).
Total mass is scaled to MSSP = 1011Msun throughout, with stars
in the range between 0.1--120 Msun. The Leitherer et al. (1999) model has
been slightly increased in luminosity (by about 0.06 mag in bolometric, at
1 Gyr) to account for the missing luminosity contribution from low-MS stars
(M* ≤1.0 Msun).
Lower plots of each panel:
model residuals with respect to the fitting functions of Table 1. See text for discussion.
|
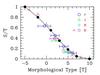 |
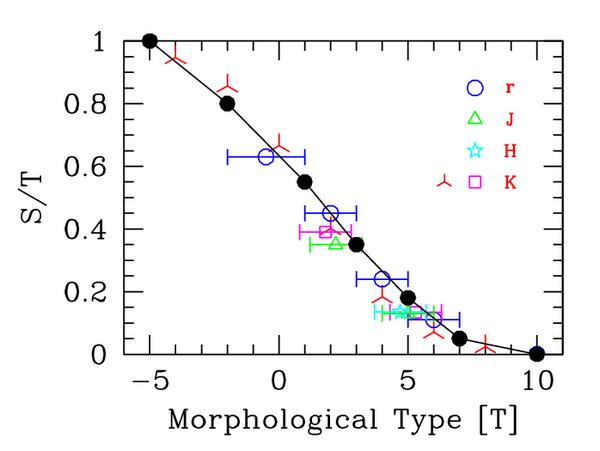
Fig. 2 - The adopted red/infrared calibration for the S/T morphological
parameter, defined as Lspheroid/Ltot (solid dots),
as derived from the data of Kent (1985; open dots), de Jong (1996;
reversed "Y" markers), Giovanardi & Hunt (1988; squares, triangles and star markers for later-type
spirals at T~5), and Moriondo et al. (1998; triangle and square markers for early-type spirals,
about T~2). Photometric bands of observations are labeled top right in the plot.
|
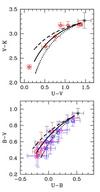 |
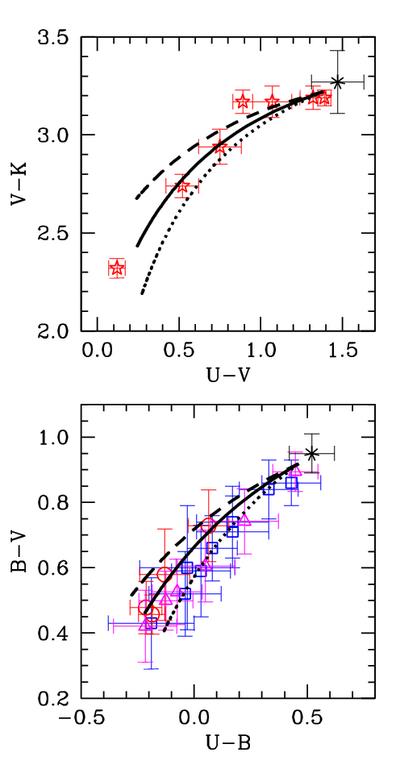
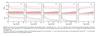
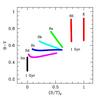
Fig. 3 - Two-color diagrams of galaxy distribution compared with 15 Gyr
model sequences for different values of disk metallicity. Data are from
Aaronson (1978; star markers), Pence (1976; open dots), Gavazzi et al. (1991; open squares), and
Buta et al. (1994; triangles).
Mean colors for ellipticals (the asterisk marker in each panel) are from Buzzoni (1995).
In the models, a disk component is added as an increasing fraction of the
total galaxy luminosity (in the sense of increasingly bluer colors).
Long-dashed line is the theoretical locus for solar metallicity, while
solid and dotted lines are for [Fe/H]disk = −0.5, and −1.0 dex,
respectively.
|
|
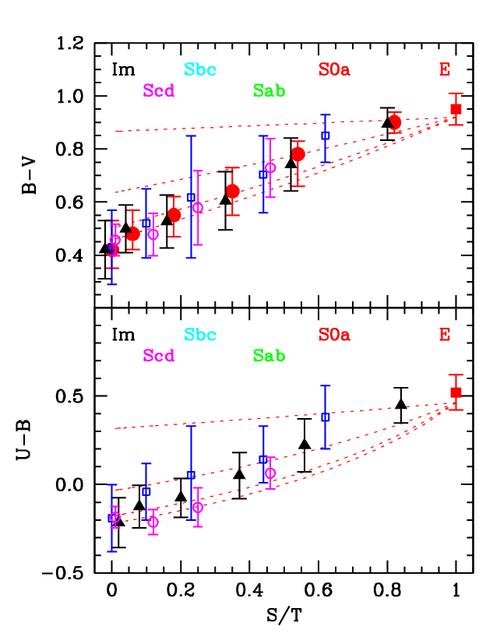
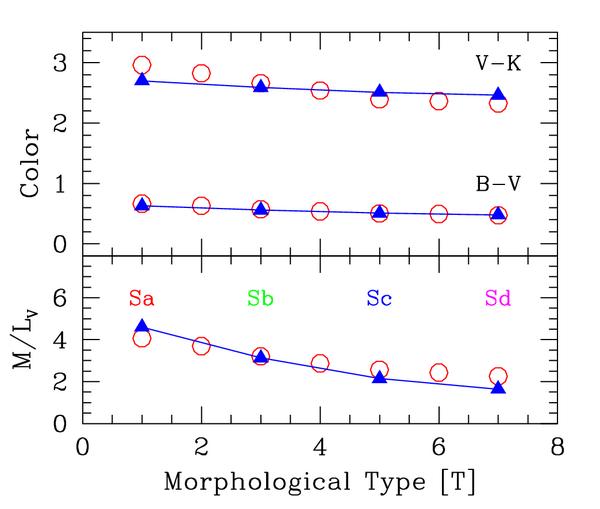
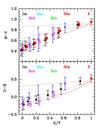
Fig. 4 - Galaxy color distribution vs. bolometric morphological parameter
S/T = Lspheroid/Ltot compared with 15 Gyr model sequences
with fixed SFR power-law index. Data are from Pence (1976; open dots), Gavazzi et al. (1991; open squares)
Roberts & Heines (1994; solid dots), and Buta et al. (1994; solid triangles).
Mean colors for ellipticals (solid square) are from Buzzoni (1995).
Dotted lines display the expected locus for models with three different values
of the SFR index, namely η = −0.8, 0, and +0.8 plus the SSP case,
in the sense of increasingly redder colors. A trend is evident in the
observations with a higher stellar birthrate for later-type systems.
|
|
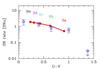
Fig. 5 - A comparison of our disk model output
(solid triangles) vs. Arimoto and Jablonka (1991) original results (open dots).
The V-band M/L ratio (in solar units) refers to the stellar mass alone
(i.e. the total mass converted to stars at the age of 15 Gyr); it has been
normalized consistently, to account for the slightly different IMF mass range
and slope (see text for discussion).
|
|
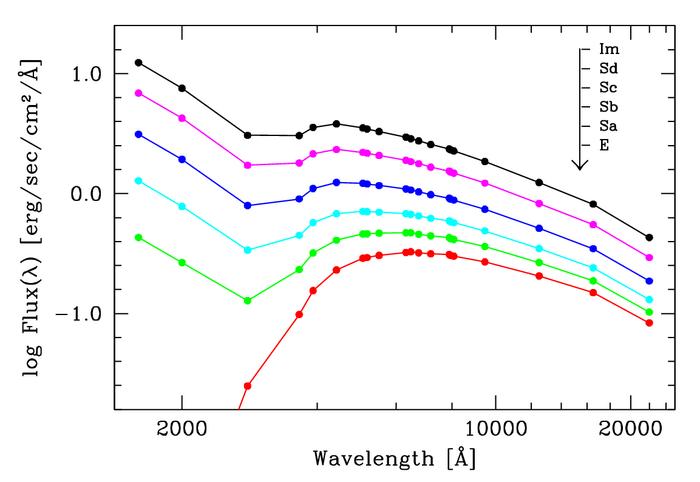
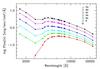
Fig. 6 - Theoretical SED for 15 Gyr template models of
Mgal = 1011 Msun along the Hubble sequence.
Multicolor magnitudes have been converted to monocromatic flux density according to the
photometric zero points of Table 1. The ultraviolet flux estimates at 1600, 2000,
and 2800 Å are from Paper I.
|
|
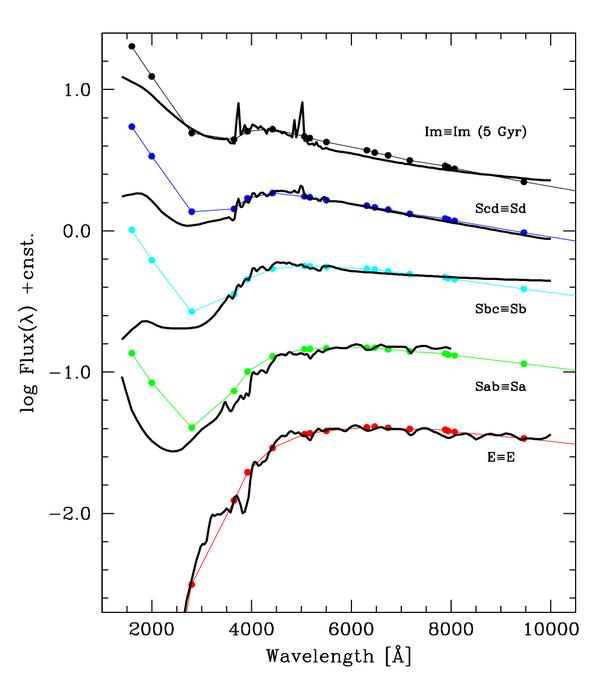
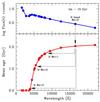
Fig. 7 - The SED for template galaxy models
(connected solid dots) is compared with "mean" empirical spectra along the Hubble morphological
sequence (thick solid line). Data for types E (the M81 case), Sbc, Scd, and Im are from
Coleman et al. (1980), while the Sab case is from Pence (1976). Empirical and theoretical
templates are matched as labeled on each plot.
|
|
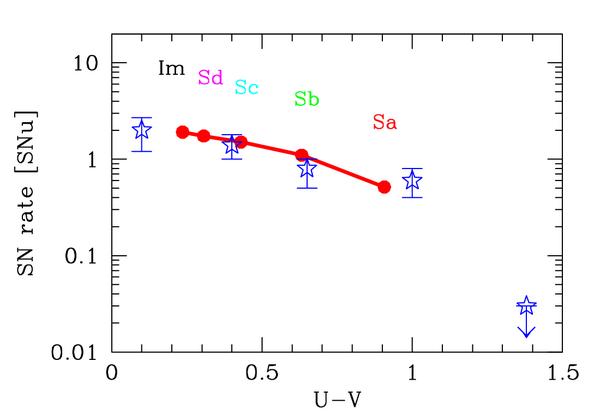
Fig. 8 - Theoretical SN(II+Ibc) rates, singled out
from eqs. (10) and (8) (solid line and dots) are compared with the empirical estimates of
Cappellaro et al. (1999) (star markers) from their survey of over 10,000 low-redshift galaxies.
The U−V refers to the galaxy integrated color (corrected for reddening in
case of observations).
|
|
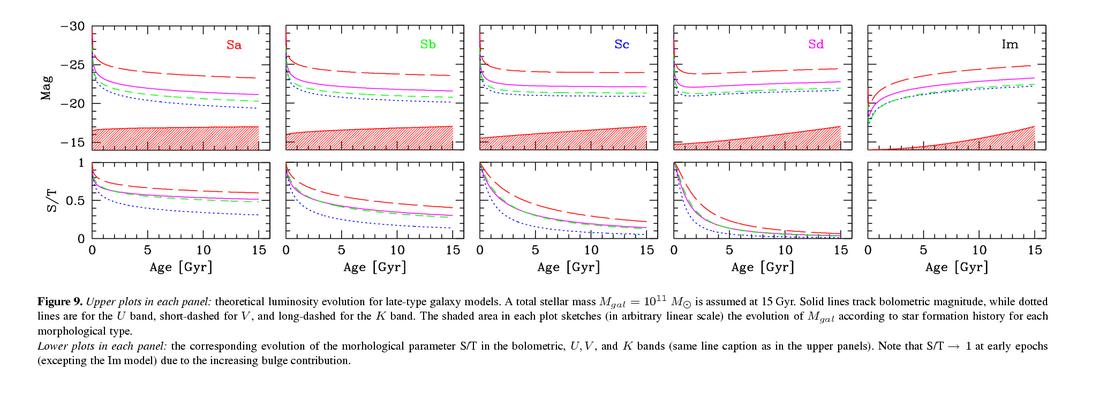
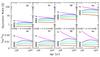
Fig. 9 -
Upper plots in each panel:
theoretical luminosity evolution for late-type galaxy models.
A total stellar mass Mgal = 1011 Msun is assumed at
15 Gyr. Solid lines track bolometric magnitude, while dotted lines are for the U band,
short-dashed for V, and long-dashed for the K band. The shaded area in each
plot sketches (in arbitrary linear scale) the evolution of Mgal according
to star formation history for each morphological type.
Lower plots in each panel: the corresponding
evolution of the morhological parameter S/T in the bolometric, U, V, and K bands (same line caption as
in the upper panels). Note that S/T→1 at early epochs (excepting the
Im model) due to the increasing bulge contribution.
|
|
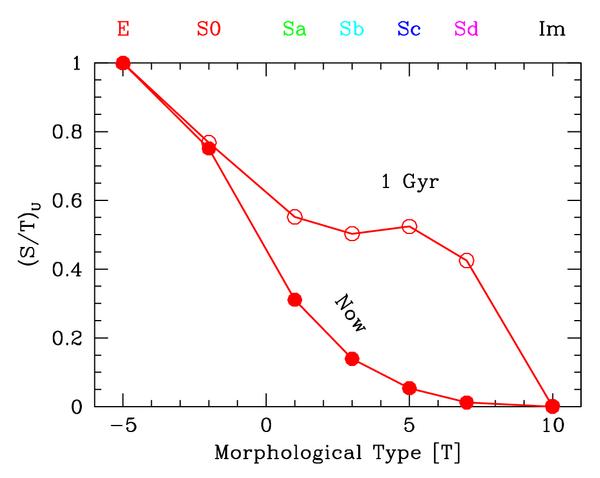
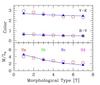
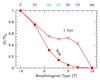
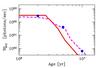
Fig. 10 - Inferred evolution of the U-band morphological
parameter S/T for galaxies along the Hubble sequence. Bulge enhancement at early epochs leads later-type
systems (Sc-Sd types) at 1 Gyr to closely resemble present-day S0-Sa galaxies.
|
|
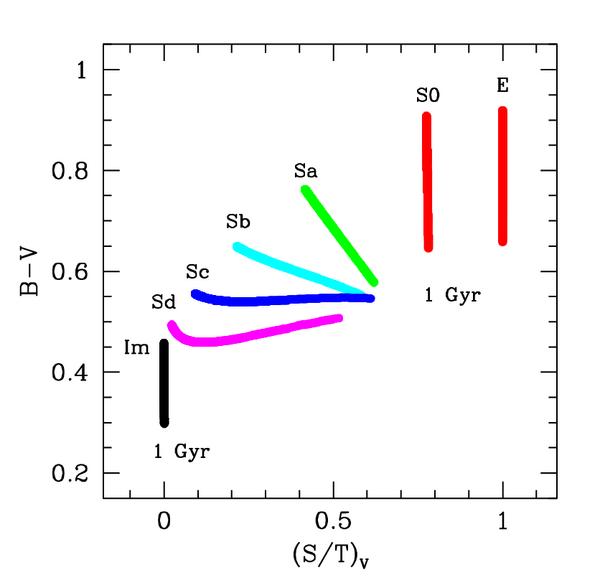
Fig. 11 - Restframe B−V color evolution,
from 15 to 1 Gyr, vs. V-band
morphological parameter S/T for galaxy models along the Hubble sequence.
The increasing luminosity contribution of the bulge component back in time makes
spiral galaxies at high redshift more nucleated than present-day homologues.
For high-redshift observations this induces a bias toward both "spiked" and
irregular systems with increasing distances (consider the x-axis
projection of the figure) and conspires against the detection of grand-design
spirals.
|
|
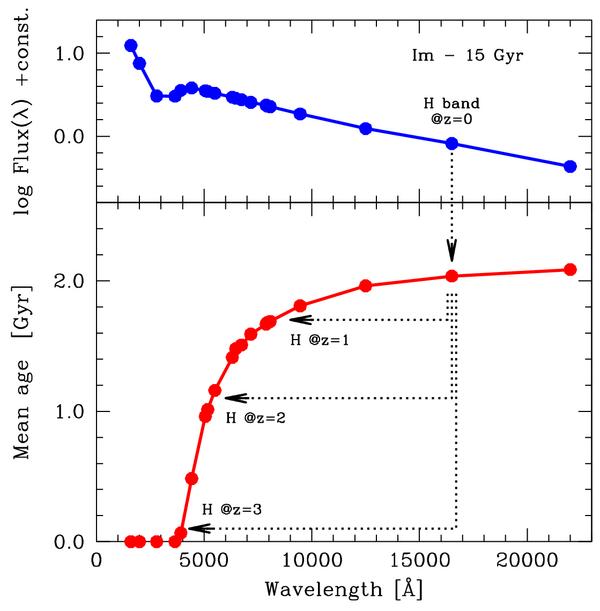
Fig. 12 - Theoretical SED for the 15 Gyr Im galaxy model
(upper panel), and "mean" age, t*,
of the prevailing stars in the different photometric bands, according to eq. (12)
(lower panel).
Note that younger (and more massive) stars contribute, in average, to global luminosity at shorter
wavelength. Assuming to observe this galaxy in the infrared H band at increasing distances (namely,
from z = 0 to 3, as labeled), one might be noticing an apparent increase in the fresh
star-formation activity with redshift (and a correspondingly younger inferred age) just as a consequence
of probing blue/ultraviolet emission in the galaxy restframe.
|
|
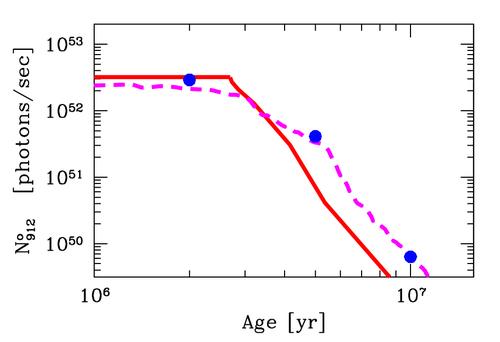
Fig. 13 - The expected rate of Lyman photons,
No912, for a Salpeter SSP
of 106 Msun with stars in the range 0.1-120 Msun. Our results
(thick solid line) consistently compare with the starburst models of Leitherer et al. (1999)
(dashed line), and Mas-Hesse and Kunth (1991) (solid dots). Both these models have been rescaled to our
output by matching the number of stars between 60 and 100 Msun.
|
|
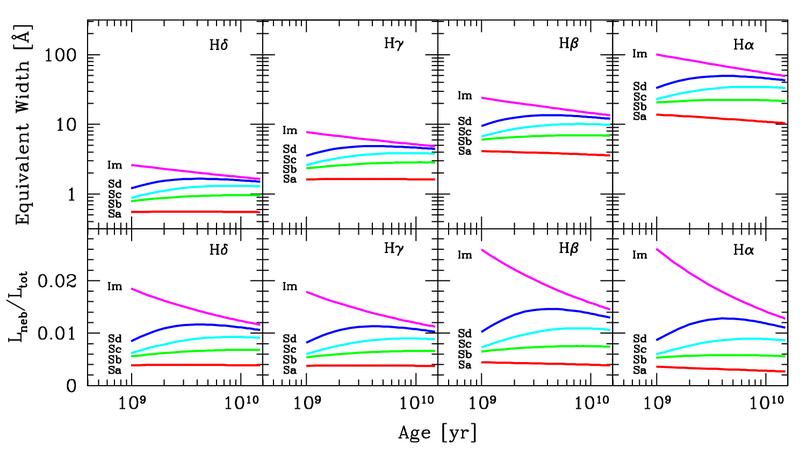
Fig. 14 - Expected evolution for Balmer emission and nebular luminosity
from residual gas in our late-type galaxy templates.
Upper panel displays the equivalent width of each Balmer feature along
galaxy age. Lower panel is the fraction of nebular luminosity supplied
to the total galaxy continuum evaluated at the relevant wavelength
close to each Balmer line.
|