Back to article listing |
Go to UVBLUE high-res spectral library |
Go to the SSP models |
| Bertone, E., Buzzoni, A., Chavez, M., Rodriguez-Merino, L.H.: |
| "ATLAS vs. NextGen model atmospheres: a combined analysis of synthetic spectral energy distributions", |
| 2004, Astron. Journal, 128, 829. |
| Summary: |
|
We carried out a critical appraisal of the two theoretical models, Kurucz'
ATLAS9 and PHOENIX/NextGen, for stellar atmosphere synthesis. Our tests relied
on the theoretical fit of spectral energy distributions (SED) for a sample of 334
target stars along the whole spectral-type
sequence, from the classical optical catalogs of Gunn & Stryker (1983) and
Jacoby et al. (1984). The best-fitting physical parameters [T(eff), log g]
of stars allowed an independent calibration of the temperature and bolometric scale
vs. empirical classification parameters (i.e. spectral type and MK
luminosity class); in addition, the comparison of the synthetic templates from
the ATLAS and NextGen grids allowed us to probe the capability of the models
to match spectrophotometric properties of real stars and assess the impact of
the different input physics. We can sketch the following main conclusions of
our analysis:
i] fitting accuracy of both theoretical libraries drastically degrades at low T(eff), where both ATLAS and NextGen models still fail to properly account for the contribution of molecular features in the observed SED of K-M stars. ii] Comparing with empirical calibrations, both ATLAS and NextGen fits tend, in average, to predict slightly warmer (by 4--8%) T(eff) for both giant and dwarf stars of fixed spectral type, but ATLAS provides in general a sensibly better fit (a factor of two lower σ of flux residuals) than NextGen. iii] There is a striking tendency of NextGen to label target stars with an effective temperature and surface gravity in excess with respect to ATLAS. The effect is especially evident for MK I-III objects, where a fraction of stars of about one in four is clearly misclassified by NextGen in log g. This is a consequence of some "degeneracy" in the solution space, partly induced by the different input physics and geometry constraints in the computation of the integrated emerging flux (ATLAS model atmospheres assume standard plane-parallel layers, while NextGen adopts, for low-gravity stars, a spherical-shell geometry). A different T(τ) vertical structure of stellar atmosphere seems also required for NextGen synthetic SEDs in order to better account for limb-darkening effects in cool stars, as supported by the recent observations of the EROS BLG2000-5 microlensing event. |
| Pick up the paper at Astro-ph/0406215 | Local link to the gzipped Postscript version (470k) | ||
| HTML version at the AJ site (*) | PDF file at the AJ site (*) | ||
| (*) Requires password |
| Unpublished Tables -
The fiducial fitting parameters for the grid of 175 stars from the Gunn & Stryker (1983) catalog
and 161 stars from Jacoby, Hunter & Christian (1984).
The ASCII tables list the derived values for T(eff) and log g after fitting of the
observed SED with the ATLAS and NextGen synthetic spectra (assuming [Fe/H] = 0.0). Get data for the Gunn & Stryker (1983) catalog, and for the Jacoby et al. (1984) stars. | |
 ASCI file |
Table 1 - Fiducial ATLAS and NextGen calibration for temperature scale and bolometric correction. |
 gzipped PS file |
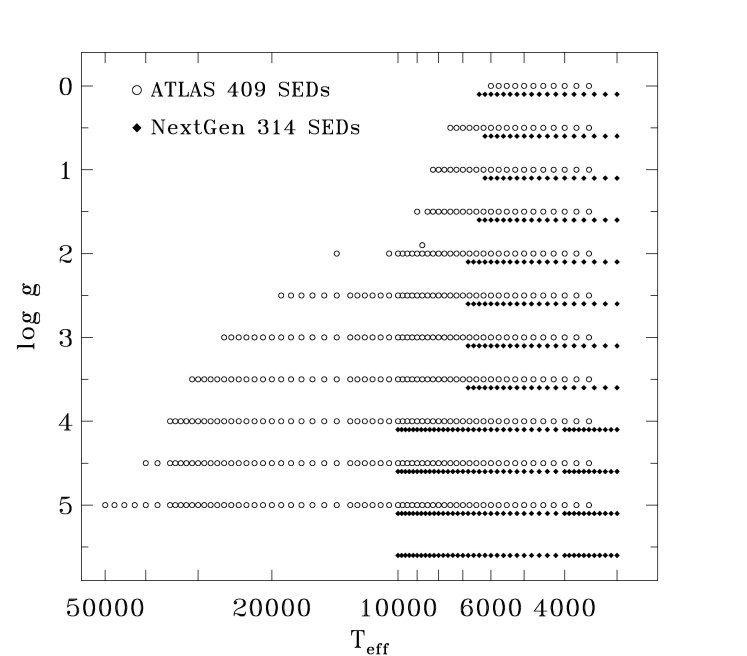
Figure 1 - The grid of 409 ATLAS and 314 NextGen theoretical models considered in our analysis. A solar metallicity has been assumed throughout. |
 gzipped PS file |
Figure 2 - The observed SED of star no. 45 from Gunn & Stryker (1983) (namely, HD 154760, of spectral type G2V) is compared with several ATLAS models. Left plots are for fixed gravity and Δ T(eff) = ± 250 K around the reference value of the central panel. Right plots are instead for fixed T(eff) and Δ log g = ± 0.5 dex. At the bottom of each panel we display the residual function X(i,j)(λ) according to eq.(1) with its standard deviation, s, from eq. (4) as labelled. The central panel is the ATLAS best-fit solution for this star. |
 gzipped PS file |
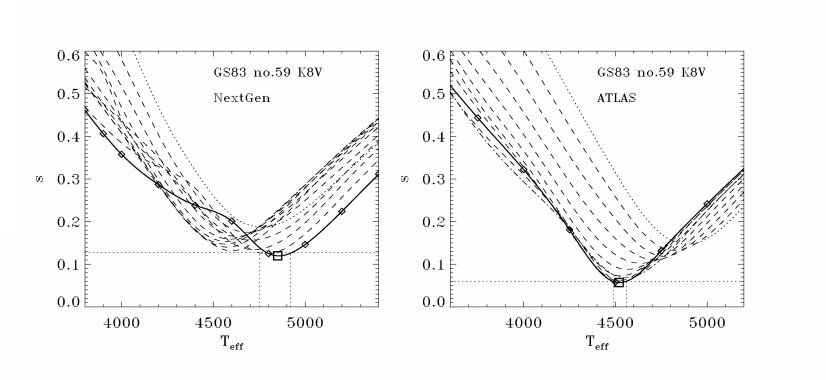
Figure 3 - Standard deviation of flux residuals for NextGen (left panel) and ATLAS (right panel) fitting models for star BD+38 2457. Each curve connects equi-gravity points in the grid vs. T(eff) (dotted line for log g = 0, dash-dotted for log g(NG) = 5.5 or log g(ATLAS) = 5.0, dashed for intermediate values). Solid line is the best-gravity solution with its minimum marked by the big open square. The horizontal dotted line shows the upper limit for s(min) at a 2-σ confidence level, as resulting from an F statistical test. The fiducial fundamental parameters for this case are T(eff) = 4850 ±70 K, log g = 5.5 ± 0.5 dex with the NextGen models, and T(eff) =4520 ± 30 K and log g = 4.0 ± 0.5 dex with the ATLAS models. Note the better accuracy of the ATLAS fit [s(min) = 0.06] compared to NextGen [s(min) = 0.12]. |
 gzipped PS file |
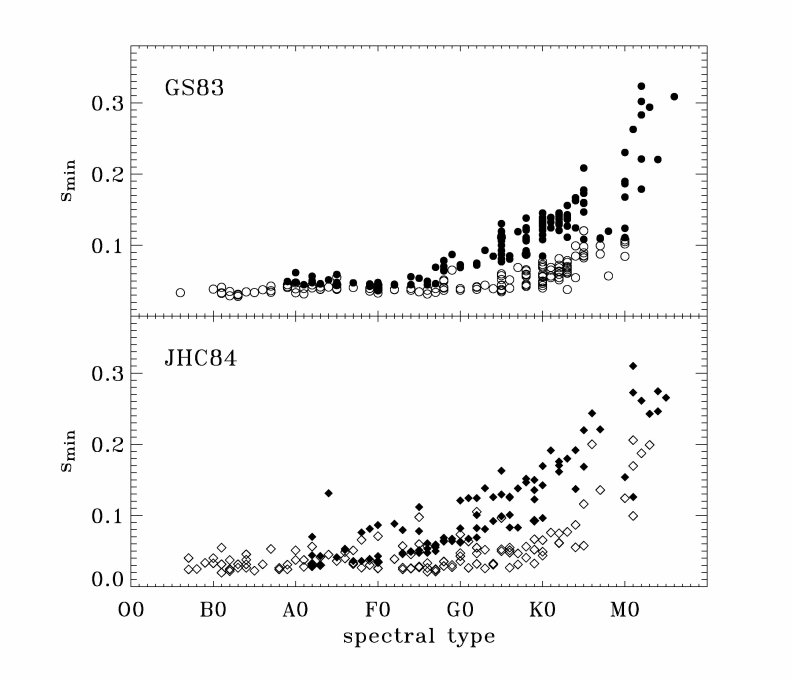
Figure 4 - The s(min) distribution vs. spectral type for the stars of the Gunn & Stryker (1983) (upper panel) and Jacoby et al. (1984) atlas (lower panel). Open markers indicate the results for ATLAS models, filled symbols those from the NextGen grid. Note, for the latter, that a limit at T(eff) ≤ 10000 K does not allow any fit to O--B stars. The value of s(min) is a measure of the mean percent accuracy of the best fit to the observed spectrum. |
 gzipped PS file |
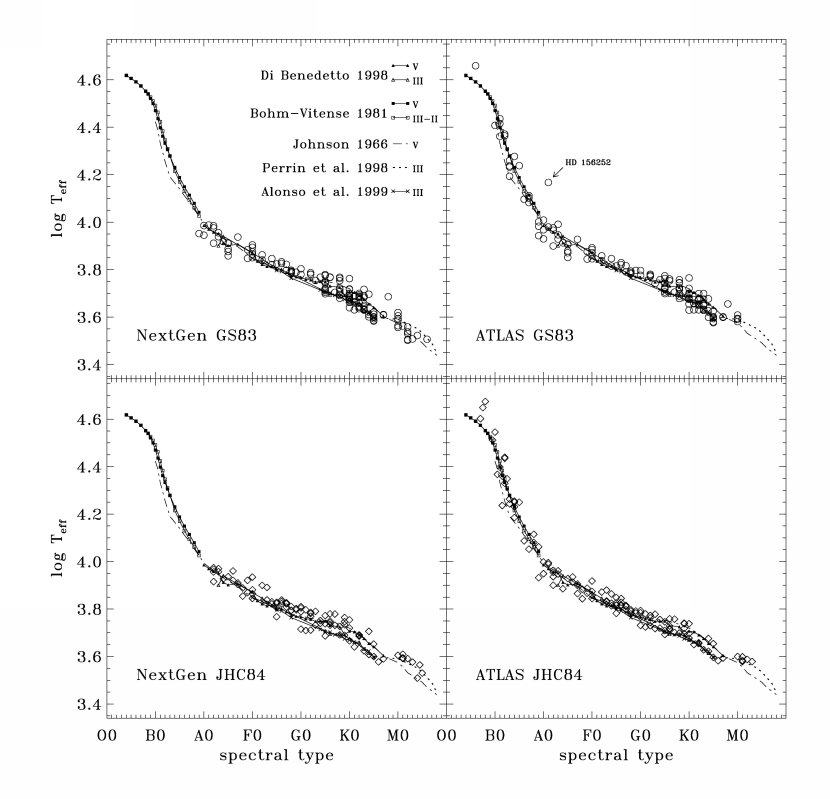
Figure 5 - The effective temperature scale as derived from the Gunn & Stryker (1983) (upper panels; dot markers) and Jacoby et al. (1984) stars (lower panels; diamond markers), after NextGen (left panels) and ATLAS (right panels) fits. Our results are compared with several empirical calibrations from the literature, as indicated in the top left panel. The outlier star HD 156252 is indicated in the top right panel (note that this object is not comprised in the NextGen plots due to an upper limit to effective temperature of the model grid at T(eff) ≤ 10000 K). See text for discussion. |
 gzipped PS file |
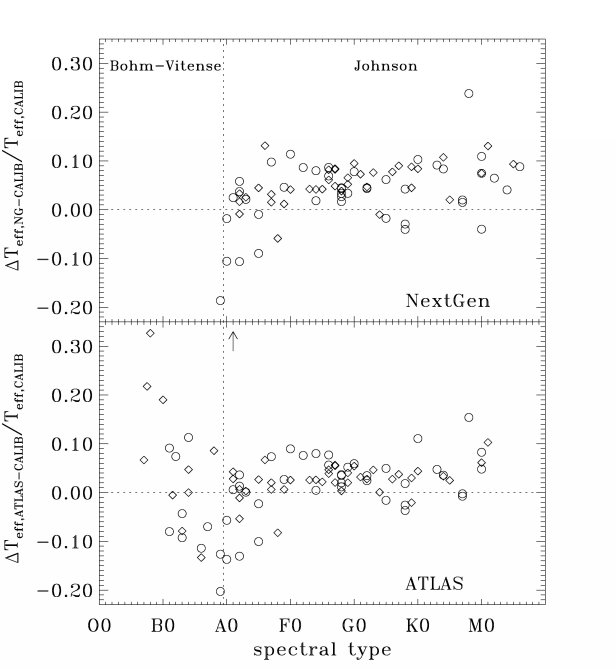
Figure 6 - T(eff) residuals vs. spectral type of ATLAS and NextGen best-fits for the subsample of MK V stars and the corresponding calibration of Johnson (1966), for A--M stars, and Böhm-Vitense (1981) for O--B-types. Open dots identify Gunn & Stryker (1983) objects, while diamonds mark the Jacoby et al. (1984) stars. The outlier HD 156252 is off the ATLAS plot, as indicated by the vertical arrow (see text for discussion). |
 gzipped PS file |
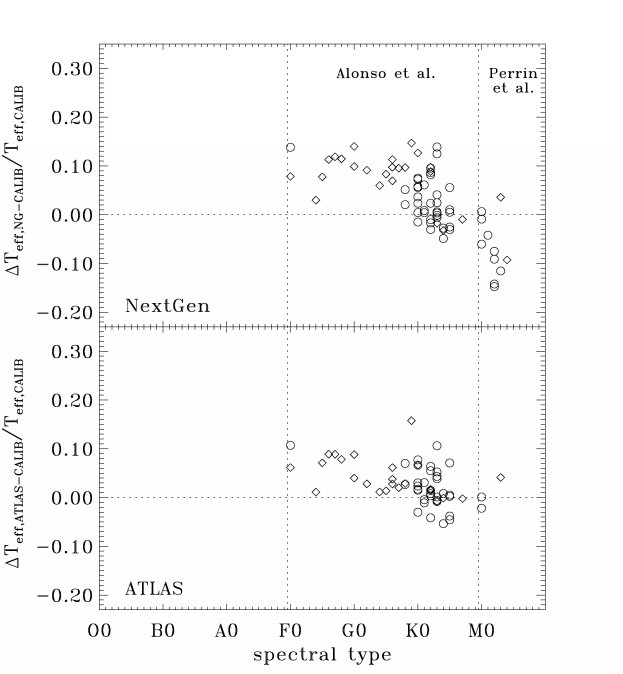
Figure 7 - As for Fig. 6, but for MK III giant stars vs. the corresponding calibrations of Alonso et al. (1999) for F--K stars, and Perrin et al. (1998) for M-type stars. |
 gzipped PS file |
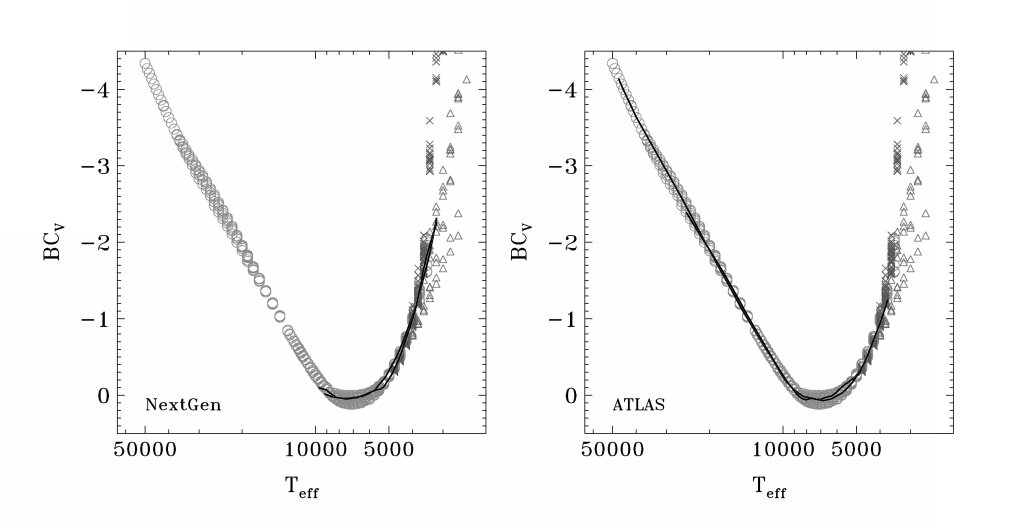
Figure 8 - Derived bolometric correction for Gunn & Stryker (1983) (open dots) and Jacoby et al. (1984) (diamonds) stars according to ATLAS and NextGen model atmospheres. Our results are compared with the empirical calibrations of Flower (1977, dotted line for MS stars, dashed for giants), Johnson (1966, solid), Bessell (1991, dashed-dotted), and Code et al. (1976, cross symbols). |
 gzipped PS file |
Figure 9 - As for Fig. 8, but vs. temperature scale for several theoretical calibrations. Our results, from Table 1 (solid lines), are compared with those of Bessell, Castelli & Plez (1998), also based on the ATLAS models (open dots), Plez et al. (1992) for cool giant models (crosses), and Edvardsson et al. (1993) for M dwarfs (triangles), both relying on the NMARCS atmosphere code of Gustafsson et al. (2003). Left panel reports our NextGen calibration, while right panel is for the ATLAS theoretical locus. |
 gzipped PS file |
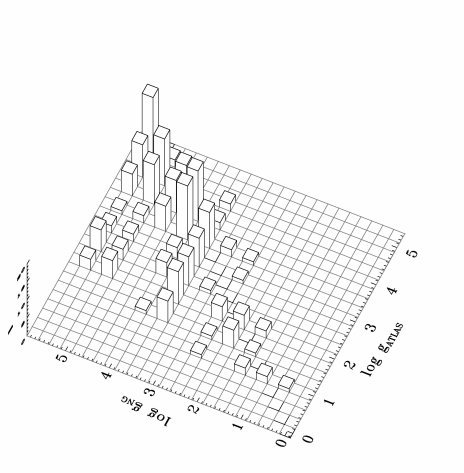
Figure 10 - The log g(NG) vs. log g(ATLAS) distribution for the sample of 216 stars with common fitting solutions. The vertical axis shows the frequency number. Note the excess of high-gravity best-fit solutions for NextGen, compared to the corresponding ATLAS distribution (see text for full discussion). |
 gzipped PS file |
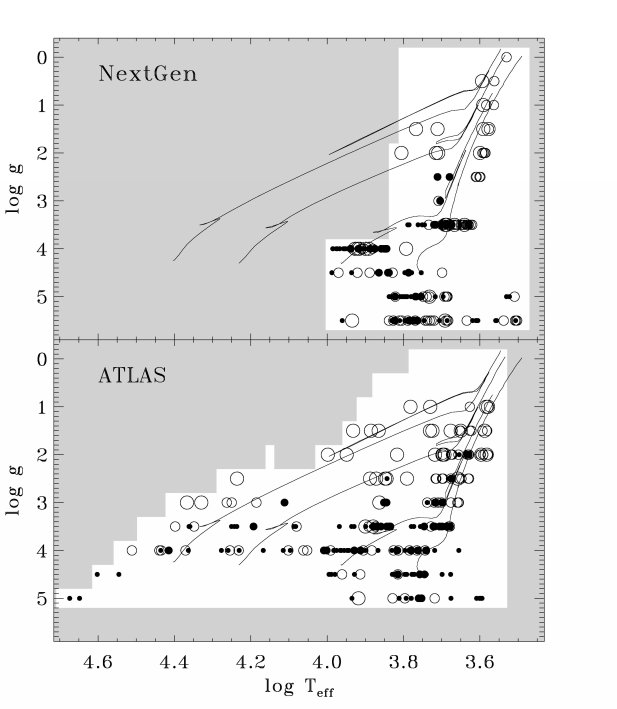
Figure 11 - The log T(eff) vs. log g distribution of ATLAS and NextGen fitting output for Gunn & Stryker (1983) and Jacoby et al. (1984) stars. The different symbols mark the luminosity class: MK V = small solid dots; IV = big solid dots, III = small open dots; II--I = big open dots. Overplotted are also the evolutionary tracks for stars of solar metallicity and M = 1, 2, and 5 M(sun) from Girardi et al. (2000), and for 10 M(sun) from Salasnich et al. (2000). The white region show the parameter space covered by the theoretical libraries (see also Fig. 1). |
 gzipped PS file |
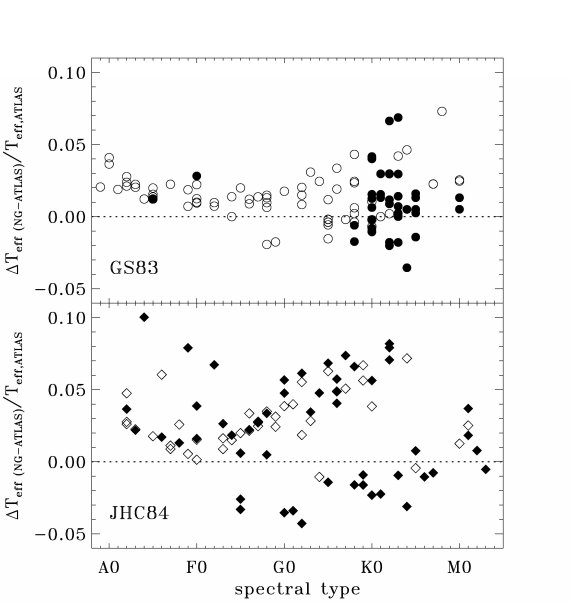
Figure 12 - Temperature residuals for the 216 Gunn & Stryker (1983) and Jacoby et al. (1984) stars (lower panel) with both ATLAS and NextGen best-fit solution. Stars are labelled according to their MK luminosity class (MK IV--V: open markers; MK I--III: solid markers). Note, in the Jacoby et al. (1984) plot, the peculiar distribution of giant stars, along two distinct point sequences. Over the whole sample, NextGen tends to predict, in average, an effective temperature about 2% warmer than the ATLAS value (see text for a full discussion of these two important features). |
 gzipped PS file |
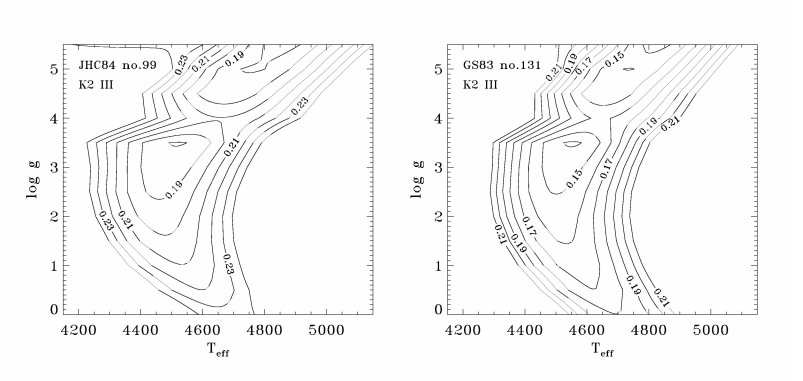
Figure 13 - An illustrative example of the NextGen fitting procedure for two K2 giant stars from the Gunn & Stryker (1983) and Jacoby et al. (1984) samples. Plotted is the map of the standard deviation, s, of residual flux between observed and theoretical SED across the model grid [according to eq. (4)] in the T(eff) vs. log g phase space. One sees that two best-fit solutions can be identified in each plot, one correctly placing the K2 III stars in the low-temperature low-gravity region (i.e. T(eff) ~ 4500 K, log g ~ 3.0 dex) and the other nominally better one shifting stars to slightly warmer temperature and much higher gravity [T(eff) ~ 4800 K, log g ~ 5.5 dex]. |
 gzipped PS file |
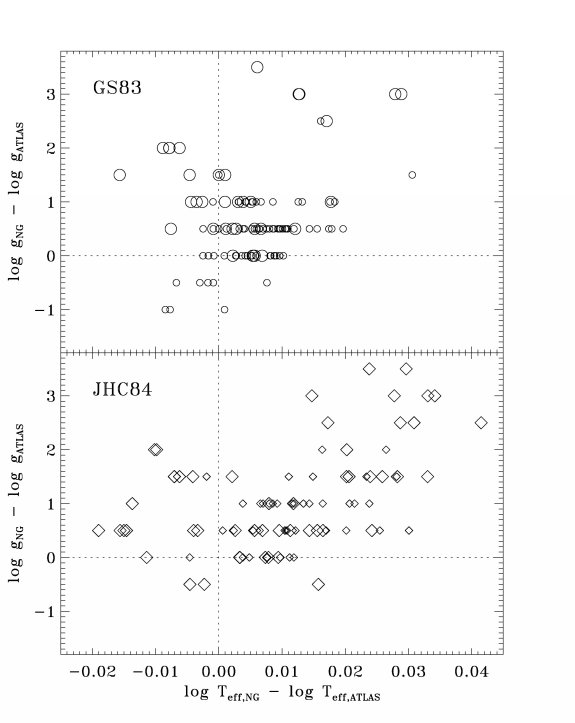
Figure 14 - Temperature and gravity difference between ATLAS and NextGen best-fit solutions for 216 stars in the Gunn & Stryker (1983) and Jacoby et al. (1984) samples. Marker size is proportional to the MK luminosity class (i.e. big markers = MK I--III giants, small markers = MK IV--V dwarfs). It is evident a correlation between Δ T(eff) and Δ log g, especially for giant stars in the Jacoby et al. (1984) plot. |
Back to article listing |
Go to UVBLUE high-res spectral library |
Go to the SSP models |
| AB/May 2005 |
|
|
