 |
Observed photometric parameters for all the galaxies
accounted for in this work can be found in this ASCII file.
|
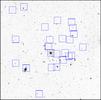 |
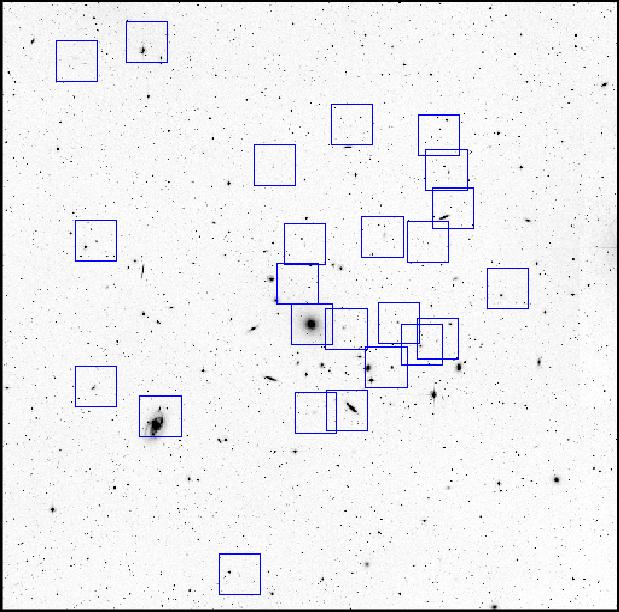
Figure 1 - DSS image of the NGC 5044 Group, showing our observed fields. The
frame is 90 arcmin on a side, North up, East to the left.
|
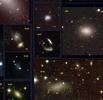 |
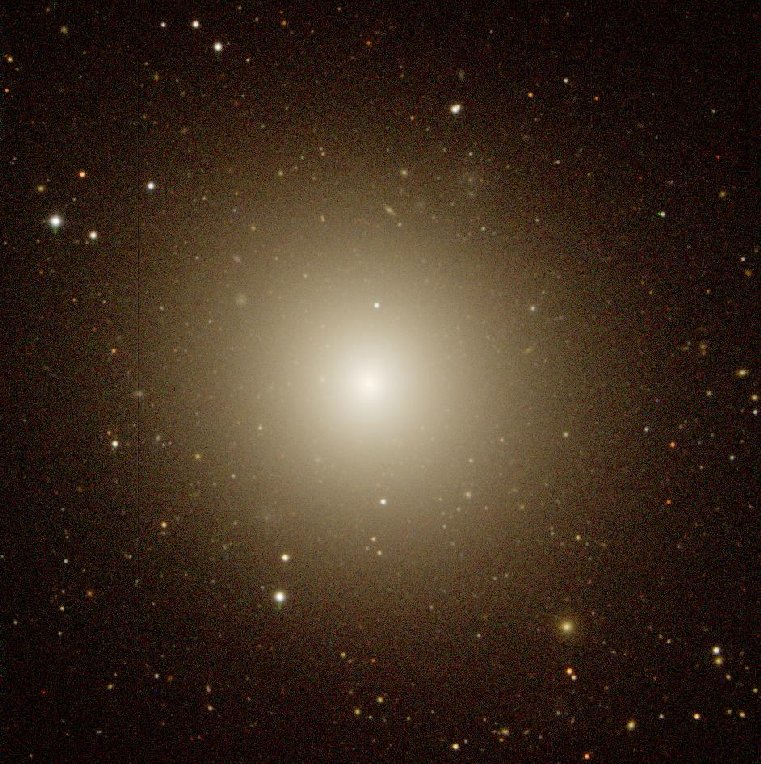
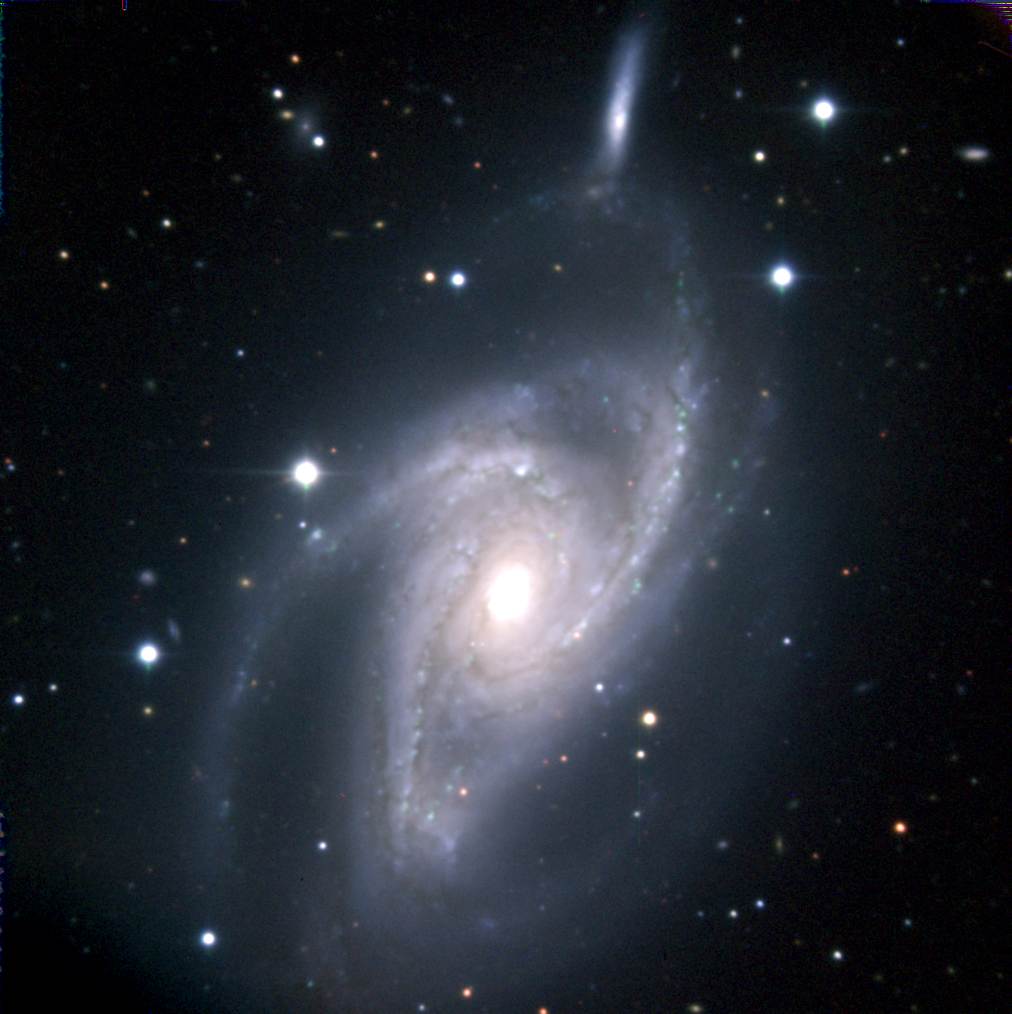
Figure 2 - True-colour atlas of all galaxies in the sample (composite images from the Gunn griz
photometry). The faintest surface brightness threshold achieved in the pictures is about
μ(g) ~ 26.5 mag/sq". Scale is the same for all frames, i.e. either 1 arcmin
(small frames), 2 arcmin (mid-size frames), or 3 arcmin on a side (big frmaes). North is up, East
to the left.
|
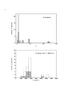 |
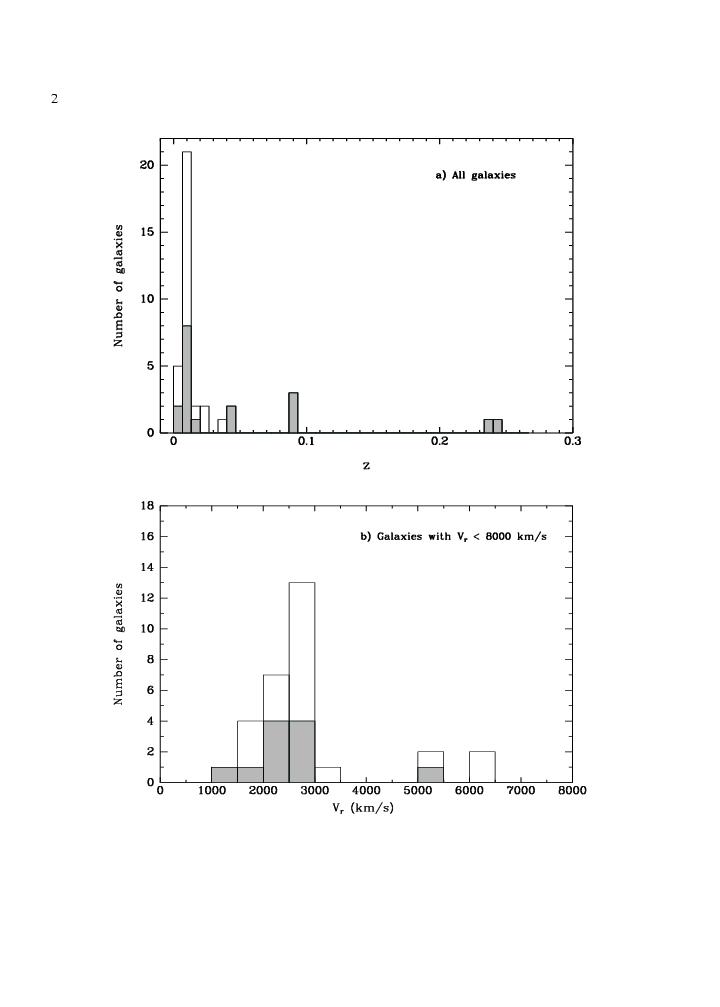
Figure 3 - Radial velocity distribution for galaxies within ~45 arcmin
from NGC 5044. Filled bars correspond to new data presented in this paper, while
empty ones show data from the literature. (a) All galaxies; (b) galaxies
with v(rad) < 8000 km/s.
|
|
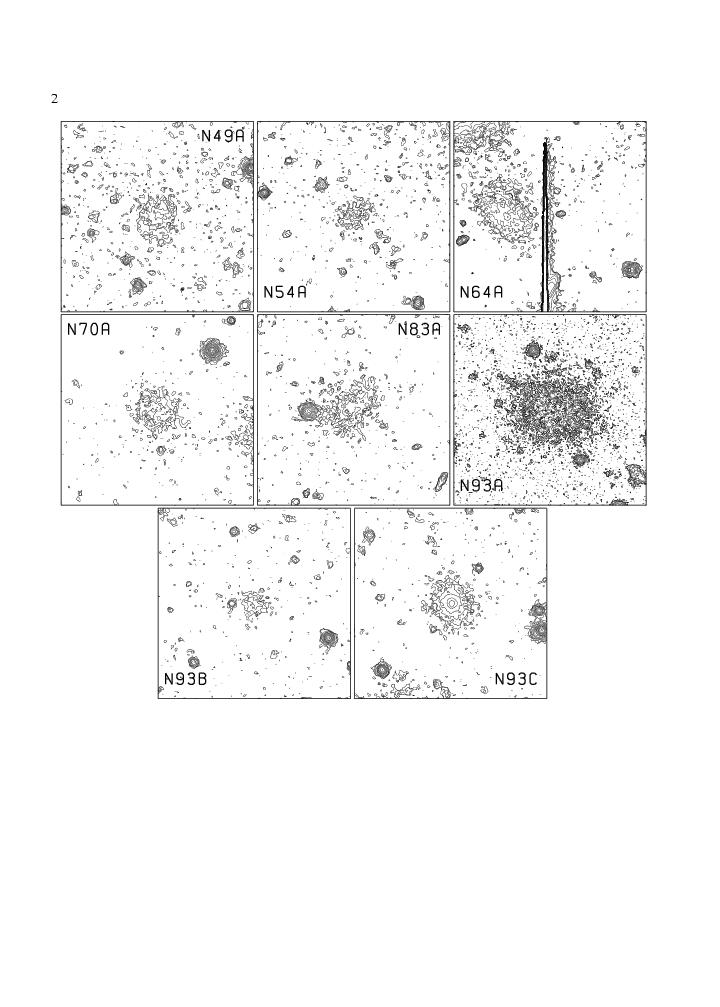
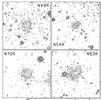
Figure 4 - Contour plots from g-band images fir the six new dSph candidates, plus the imaged field
for galaxies N49A and N83A, already reported in Cellone (1999). The faintest contour corresponds to
μ(g) = 26.5 mag/sq", with Δμ = 0.5 mag/sq" between adjacent
contours. Each image is 1 arcmin on a side, with North up and East to the left.
A coordinate list of the six new galaxies can be found in this
ASCII file.
|
|
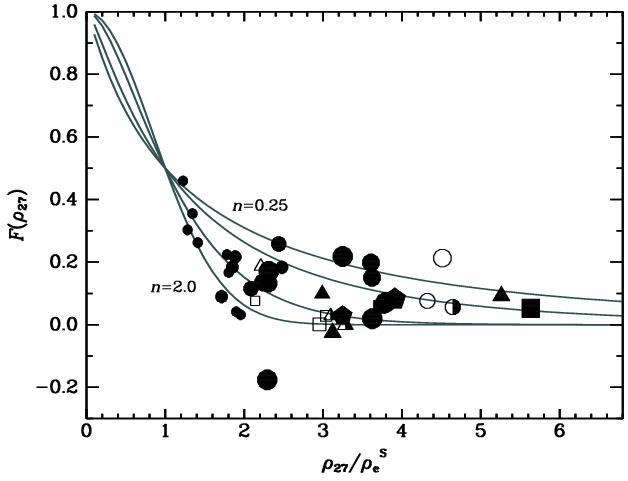
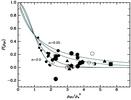
Figure 5 - Fraction of galaxy light beyond the isophotal radius vs. isophotal
to effective radius ratio. Circles: E--dE; pentagons: S0--dS0; squares:
Sa--Sc; triangles: Sd--Im. Filled symbols: definite members; open symbols:
background objects; half-filled symbols: dubious cases. Symbol sizes are
proportional to integrated magnitudes. Curves obtained from
eq. (1) are shown for n=0.25, n=0.4, n=1, and n=2.
Note the outlier object (N42 in our catalog) at F(ρ27)=-0.18, as
discussed in the text.
|
|
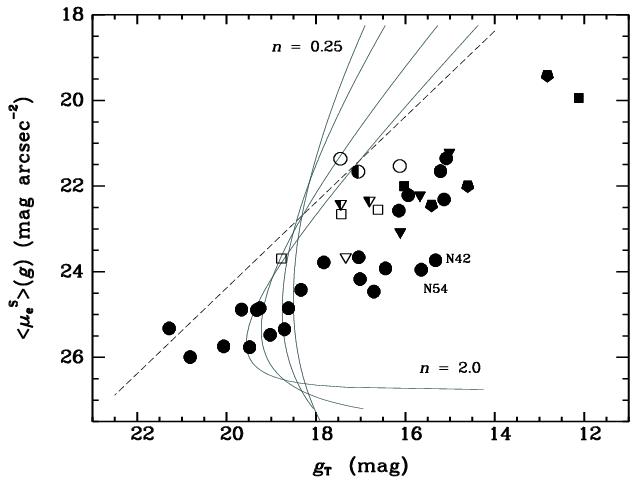
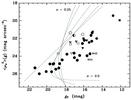
Figure 6 - Mean effective surface brightness vs. integrated magnitude, both
obtained from the model fits in the g Gunn band. Symbol coding is the same
as for Fig. 5. Dashed line: constant effective radius,
ρ_S(e) = 3 arcsec. Solid lines: survey limits in
FS90 (equivalent to ρ=8 arcsec at μ(B) = 27 mag/sq"),
for n=0.25, n=0.4, n=1, and n=2. Galaxies N42 and N54 (see text) are
labelled. Photometry has been corrected for Galactic reddening according to
Burstein and Heiles (1982).
|
|
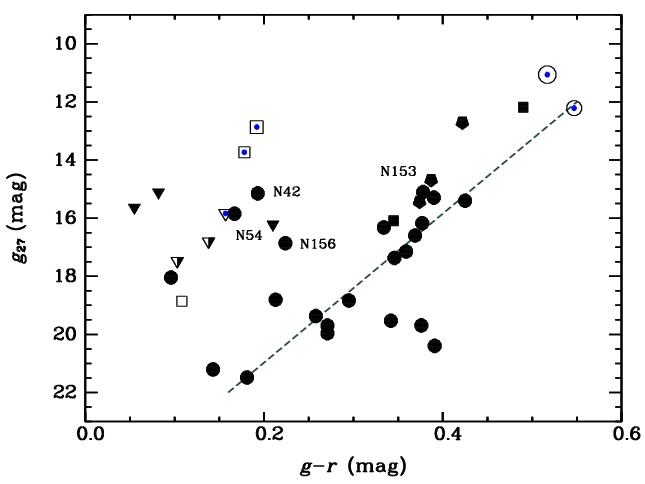
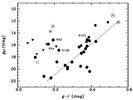
Figure 7 - Isophotal colour -- magnitude diagram for our sample. Symbol
coding is the same as for Fig.5, except that dotted open
symbols correspond to background objects with known redshifts corrected to
the distance of the NGC 5044 Group. The dashed line is the R vs. B-R,
relation for Coma dEs from Secker et al. (1997), transformed to the Gunn system and
corrected for distance. Data have been corrected for Galactic
reddening according to Burstein and Heiles (1982), as explained in Sec. 5.2.
|