Filters and Photometric systems
The hyperz package provides also the response functions of the filters,
contained in the file ./ZPHOT/filters/FILTER.RES. This file is
an extension of the file provided in the GISSEL library by Bruzual &
Charlot (1993) and at this stage it includes  filters. You can add your own filters appending their transmission functions
at the end of the file according to the following format: the first line
must contain the number of points forming the transmission function (compulsory,
no more than
  points are accepted) and the name of the filter (optional). The subsequent
lines must contain in the first column the number of the point, in column
two the wavelength in Å and in column three the value of the transmission.
Take care that if your response function contains more than
  points, the program will proceed with a rebinning to include only
  points, because otherwise the integration would be too CPU time consuming.
Notice that the points must be ordered by increasing wavelengths. Moreover,
do not care about the normalization of the transmission functions, because
this operation will be performed internally in hyperz. In Figure
8 we illustrate the transmission functions
of the most used filters, corresponding to the records #
  ,
,  ,
, ,
,  ,
,  ,
,  ,
,  ,
,  ,
,  ,
,  ,
,  ,
,  ,
,  ,
, .
.
Two reminder files are included in the package, even if they are not
used during the computation: ./ZPHOT/filters/filters.log contains
the list of the filters contained in ./ZPHOT/filters/FILTER.RES,
their record number and the number of points composing their transmission
function; ./ZPHOT/filters/filters.dat contains a description of
the filters by means of their  ,
their surface
  ,
their width, computed as described in Section 3.2,
and the conversion between Vega and AB magnitudes..
 |
Figure:Normalized filter's
transmission functions of some of the most used filters.
The program hyperz works with ``standard'' Vega magnitudes, as well
as with AB magnitudes. The first photometric system is calibrated on the
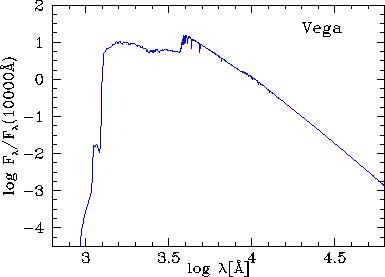
Vega Spectral Energy Distribution shown in Figure 9
and taken from the Bruzual & Charlot (1993) library. In the formulae
we have
![\begin{displaymath}m_{\rm Vega} = -2.5 \left[ \log \int R(\lambda) f(\lambda)\, ......g \int R(\lambda) f_{\rm Vega}(\lambda)\, d\lambda \right] \: ,\end{displaymath}](img333.gif)
where  is in unit of
  .
AB magnitudes are defined in such a way that the zero point is set equal
for all filters and are directly related to the flux
  :
:  ,
where
  is given in
  ,
and thus AB magnitudes can be monochromatic. An object having a flat spectrum
will have equal magnitudes in all the filters. The conversion between Vega
and AB magnitudes for a given filter is computed using the equation:

 |
Figure:Spectral Energy Distribution
of  Lyrae
(Vega). Data from GISSEL library.
micol bolzonella
2000-12-10
![]() ,
their surface
,
their surface ![]() ,
their width, computed as described in Section 3.2,
and the conversion between Vega and AB magnitudes..
,
their width, computed as described in Section 3.2,
and the conversion between Vega and AB magnitudes..

![]() is in unit of
is in unit of ![]() .
AB magnitudes are defined in such a way that the zero point is set equal
for all filters and are directly related to the flux
.
AB magnitudes are defined in such a way that the zero point is set equal
for all filters and are directly related to the flux ![]() :
: ![]() ,
where
,
where ![]() is given in
is given in ![]() ,
and thus AB magnitudes can be monochromatic. An object having a flat spectrum
will have equal magnitudes in all the filters. The conversion between Vega
and AB magnitudes for a given filter is computed using the equation:
,
and thus AB magnitudes can be monochromatic. An object having a flat spectrum
will have equal magnitudes in all the filters. The conversion between Vega
and AB magnitudes for a given filter is computed using the equation:

