Back to article listing

Back to article listing |
|
Shortcut to the SSP models |
| Carraro, G., Buzzoni, A., Bertone, E., and Buson, L.: |
| "UB CCD photometry of the old, metal rich, open clusters
NGC 6791, NGC 6819 and NGC 7142", 2013, Astronomical Journal, 146, 128 |
|
|
Summary:
We report on a UV-oriented imaging survey in the fields of the old, metal-rich
open clusters, NGC 6791, NGC 6819 and NGC 7142. With their super-solar metallicity
and ages ≥3-8 Gyr, these three clusters represent both very near and ideal
stellar aggregates to match the distinctive properties of the evolved stellar
populations, as in elliptical galaxies and bulges of spirals. Following a first
discussion of NGC 6791 observations in an accompanying paper, here, we complete
our analysis, also presenting for NGC 6819 and NGC 7142 the first-ever U CCD
photometry.
The color magnitude diagram of the three clusters is analyzed in detail,
with special emphasis to the hot stellar component. We report, in this regard,
one new extreme horizontal-branch star candidate in NGC 6791.
For NGC 6819 and 7142, the stellar luminosity function clearly points to
a looser radial distribution of faint lower Main Sequence stars, either as a consequence
of cluster dynamical interaction with the Galaxy or as an effect of an increasing fraction
of binary stars toward the cluster core, as actually observed in NGC 6791 too.
Compared to a reference theoretical model for the Galaxy disk, the analysis of the
stellar field along the line of sight of each cluster indicates that a more centrally
concentrated thick disk, on a scale length shorter than ~2.8 kpc, might better
reconcile the lower observed fraction of bright field stars and their white-dwarf
progeny.
|
| Pick up the paper at Astro-ph/1309.xxxx | Local link to the PDF version (2.3 Mb) | ||
| Enhanced HTML/PDF version at the AJ site (soon available) (*) | |||
| (*)May require access password |
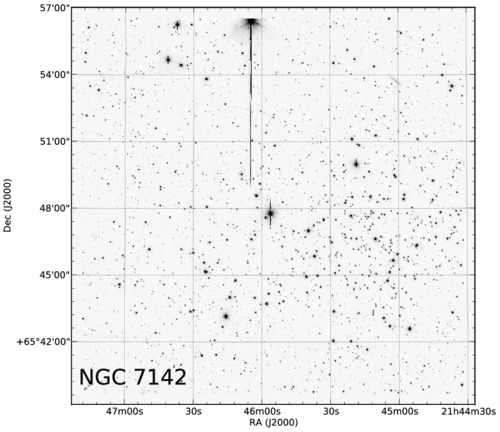 |
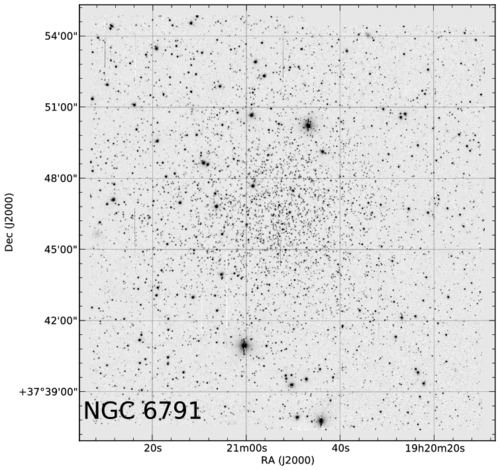
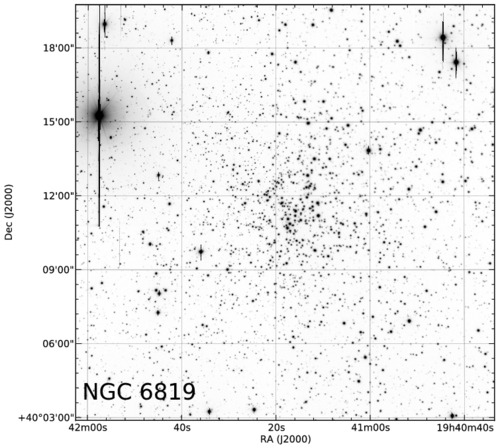
Figure 1a,b,c -
B 300 secs mosaics of the 4 pointings for each cluster, NGC 6791,
NGC 6819, and NGC 7142, as labelled in each panel. The field of view is 17 arcmin
on a side. North is up, East to the left.
|
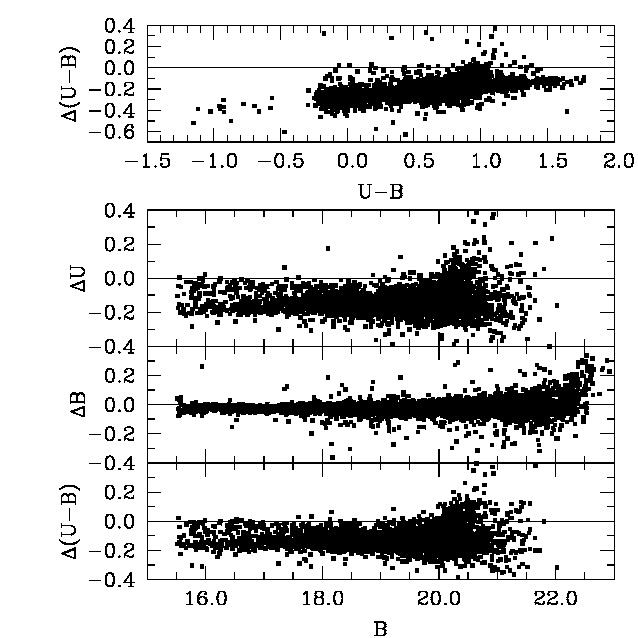
| Figure 2 -
U, B cross-correlation of our photometry with KR95 data for cluster
NGC 6791. Color and magnitude differences for the 5510 stars in common
are displayed in the different panels versus our photometry. Mean zero-point offsets
are in the sense ("our photometry" − KR95). Note, in the upper panel, the
evident (U-B) color drift of KR95 photometry with respect to our data.
|
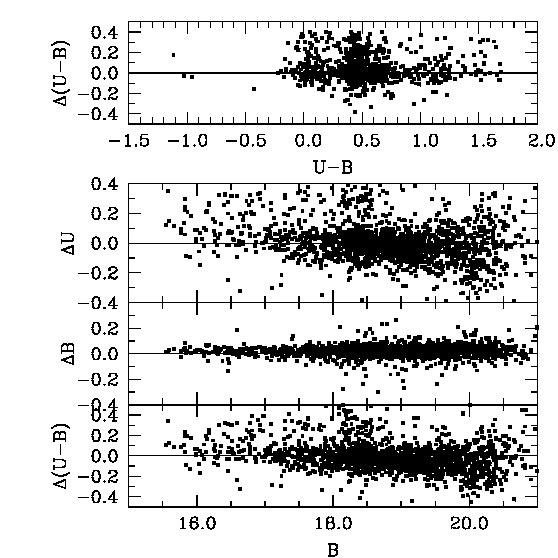 |
Figure 3 -
Same as Fig. 2, but comparing with Montgomery et al. (1994) CCD magnitudes of 2370
NGC 6791 stars in common with our dataset. Magnitude residuals are in the sense
("our photometry" − Montgomery et al.), and are plotted against our photometry.
The vanishing residual distribution in the different panels confirms that our
photometry is in the same reference as that of Montgomery et al.
|
|
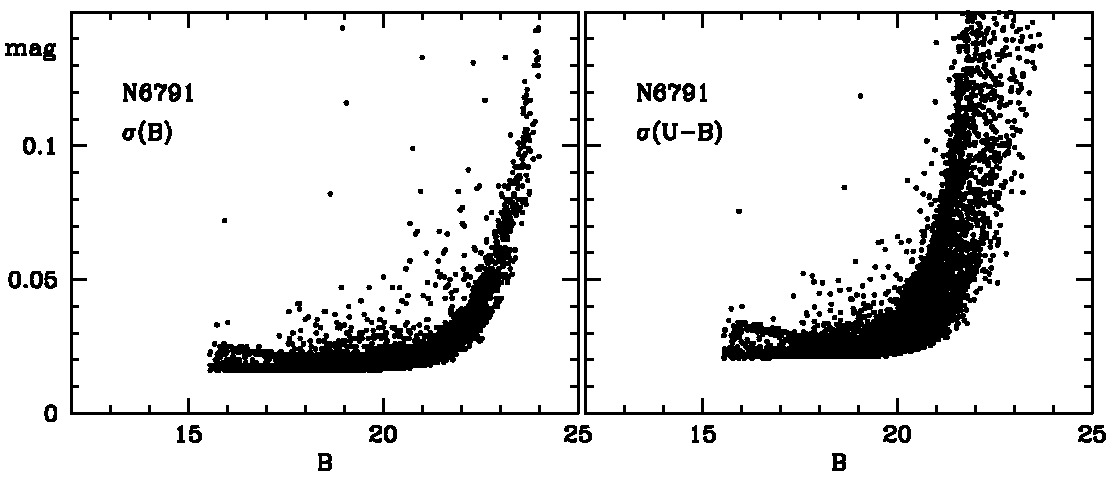
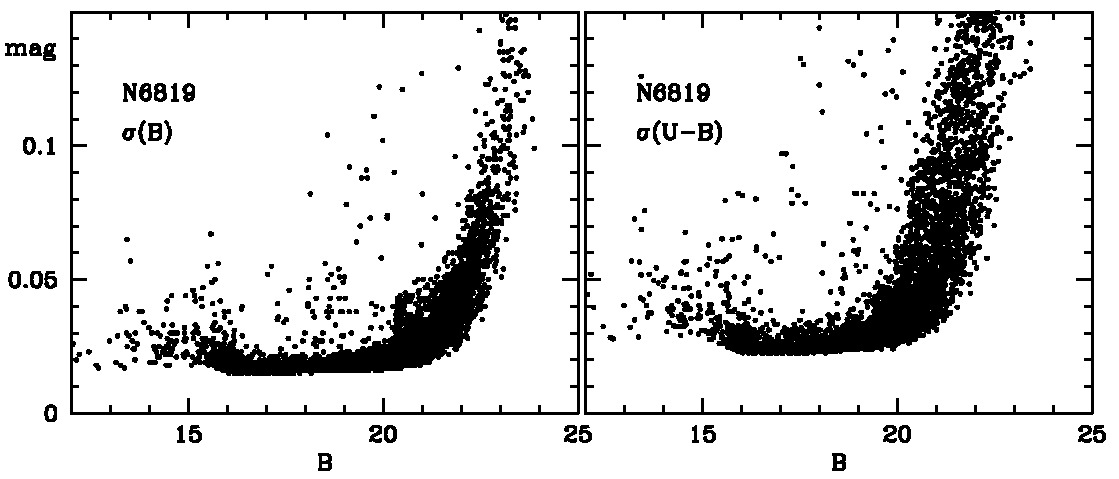
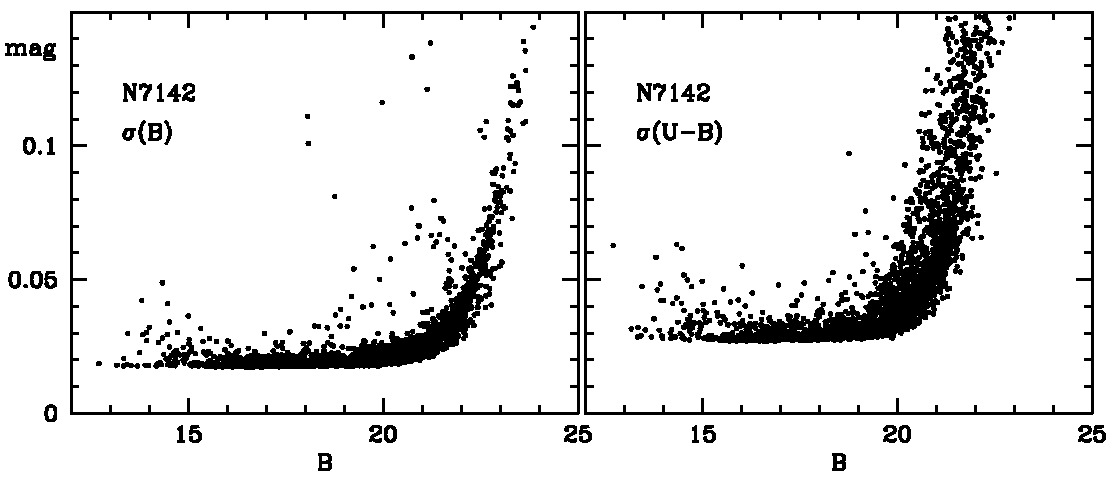
Figure 4a,b,c -
B-band internal errors from DAOPHOT photometry in the field of
NGC 6791, NGC 6819 and NGC 7142. Where available, "shallow" imagery has been used for the
photometry of the brightest (B ≤ 15.5) stars in the fields of NGC 6819
and 7142, as explained in Sec. 2. The bright-end star distribution in the NGC 6791
field, on the contrary, has been recovered from KR95 photometry, as discussed in Sec. 3.1.
One can notice that the B ~22 mag level has been safely reached
in the three clusters, mostly within a 0.05 mag accuracy.
|
|
|
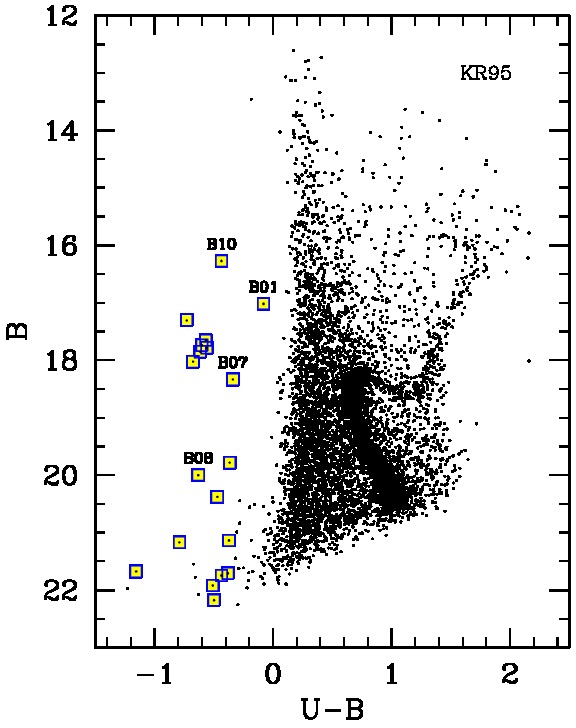
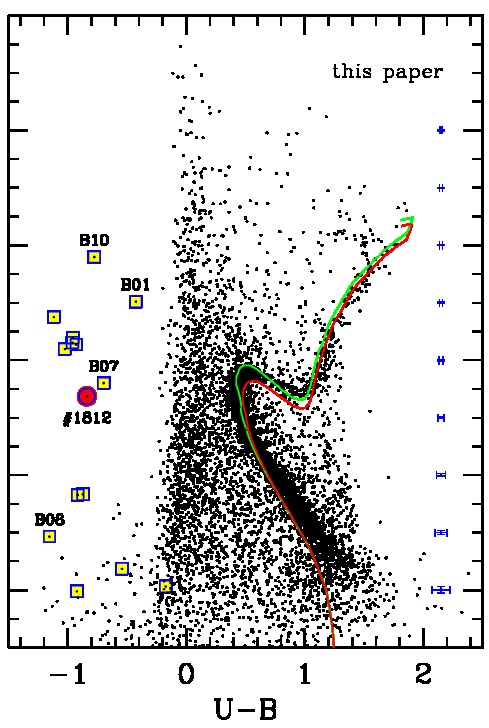
Figure 5a,b -
Comparison of the B versus (U-B) CMD of NGC 6791 according to
Kaluzny & Rucinski (1995) Panel "a" and the present paper Panel "b".
The KR95 hot-star candidates of Table 4 and 5 (including in particular
the outstanding EHB stellar clump about B ~ 18) are marked in both plots as
big squares. The three controversial cases of stars B01, B07 and B10 are also
labelled in the plots, together with stars B08, the hottest object in our sample.
The big dot in the right panel indicates the new EHB candidate (ID 1812 in
Table 4) we discovered in this study.
An illustrative match with the Padova isochrone set Bertelli et al. (2008) is displayed
in the right panel assuming for the cluster an age range between
6 and 8 Gyr and chemical mix (Z, Y) = (0.04, 0.30). The theoretical models
have been shifted to an apparent B distance modulus (m-M)B = 13.6 mag and
reddened by E(U-B) = 0.13. Typical error bars for our photometry at the
different magnitude levels are displayed on the right.
|
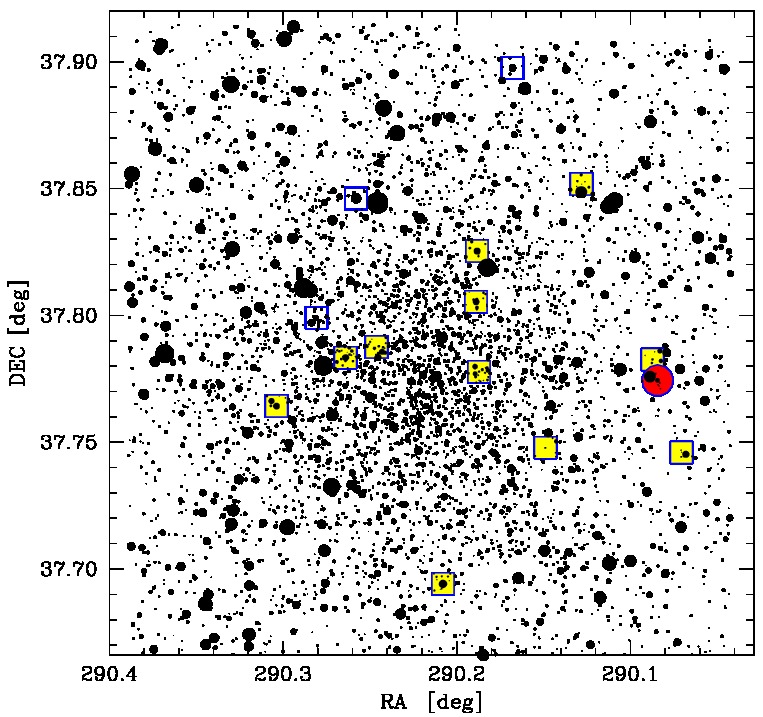 |
Figure 6 -
The new EHB candidate proposed in this study is located here on the cluster map of NGC 6791
(big red solid dot) together with the Kaluzny & Rucinski (1995) hot-star sample, as from Fig. 5
(square markers). The questioned member stars, B01 and B07 and B10, are singled out with open squares.
|
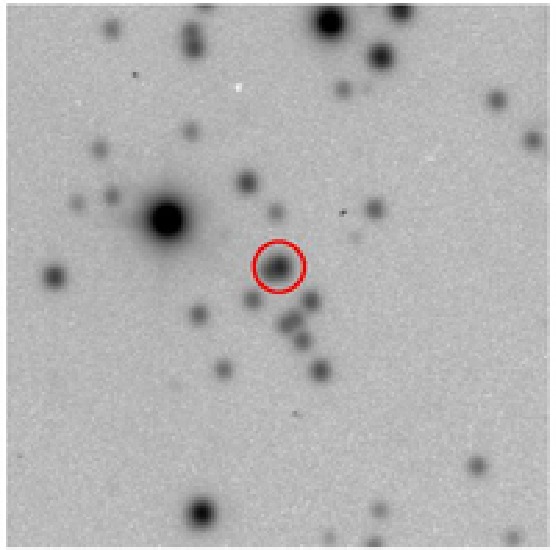 |
Figure 7 -
The B-band finding charts for the new EHB candidate in NGC 6791 proposed
in this study. This is star ID #1812 in our catalog. Chart is 1 arcmin × 1 arcmin across,
centered at the coordinates of Table 4. North is up, East to the left.
|
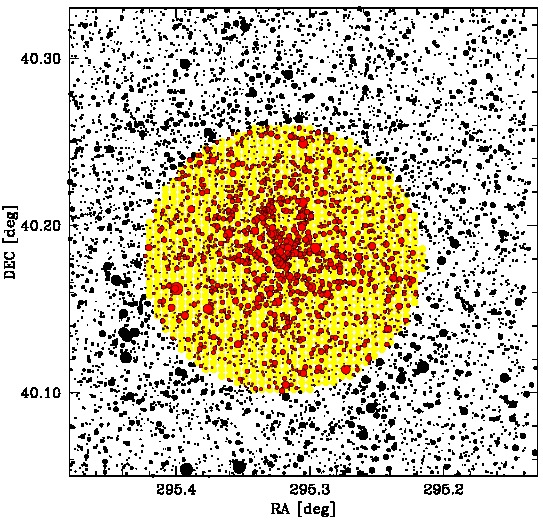 |
Figure 8 -
Overall map of the surveyed field across NGC 6819. The central spot
locates the "inner" region of 5 arcmin radius surrounding the cluster center.
Some very bright stars East to the cluster have been masked (see Fig. 1) preventing
accurate photometry in the relatively close region.
|
|
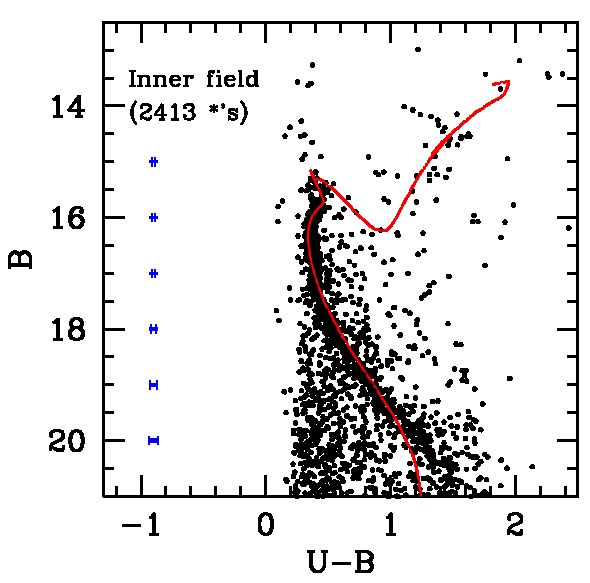
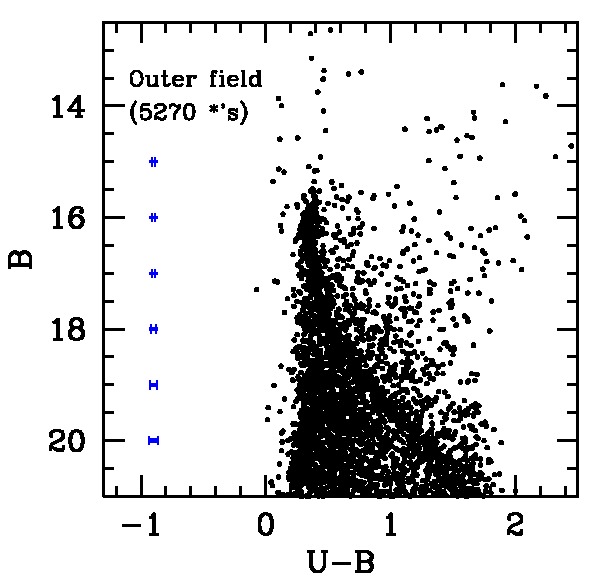
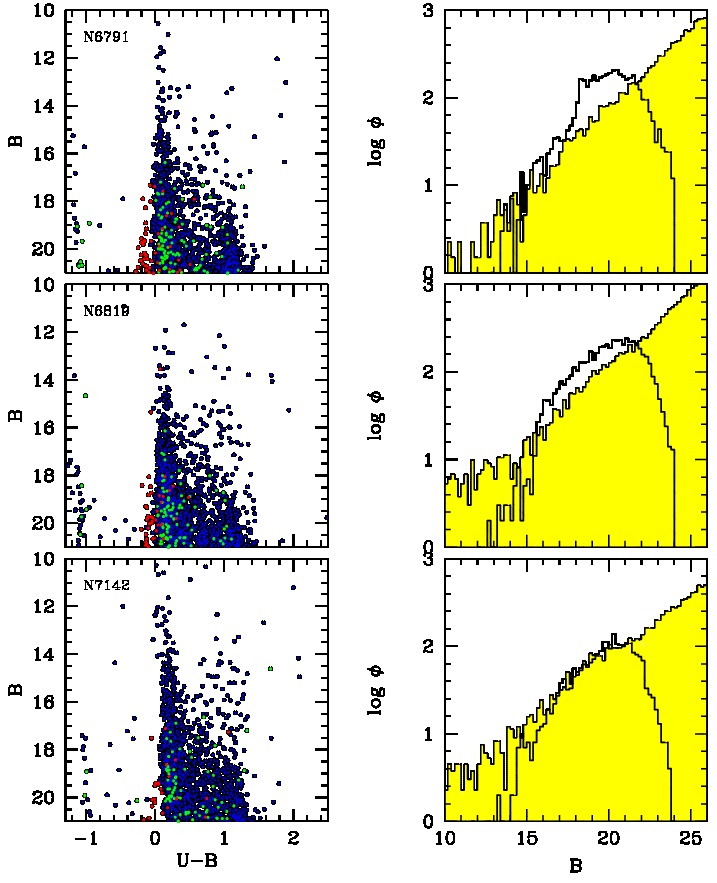
Figure 9a,b -
Panel "a": the B versus (U-B) CMD of the "inner" region (within 5 arcmin from the cluster
center) of NGC 6819. A total of 2413 stars brighter than B = 24.0 are displayed,
as labelled. Note the "hooked" Turn Off pattern about B ~ 15.5 and the red clump of HB
stars, about 1 mag brighter, about (U-B) ~ 1.4.
A tentative match with the 3 Gyr Padova isochrone Bertelli et al. (2008) is displayed for
(Z, Y) = (0.04, 0.30). We imposed an apparent B distance modulus
(m-M)B = 12.0 mag and a color excess E(U-B) = 0.15.
Panel "b": same plot but for stars in the "outer" region of the field, that is beyond 5 arcmin from cluster center (5270 objects in total, within the same magnitude limit). For both panels, typical error bars for our photometry at the different magnitude levels are displayed on the left. |
|
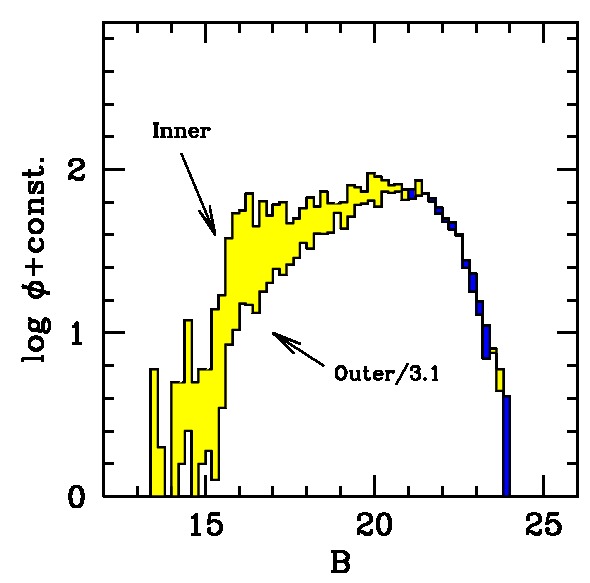
Figure 10 -
The apparent B-luminosity function of the "inner" and "outer" regions
across the NGC~6819 field. To consistently compare the two regions, "outer" star counts
have been reduced by a factor of ~3.1 to rescale to the same area as for the "inner"
region.
Note the inner residual excess of bright red giants and upper-MS stars and the lack of any
central concentration for the low-MS stellar distribution fainter than B~20.
|
|
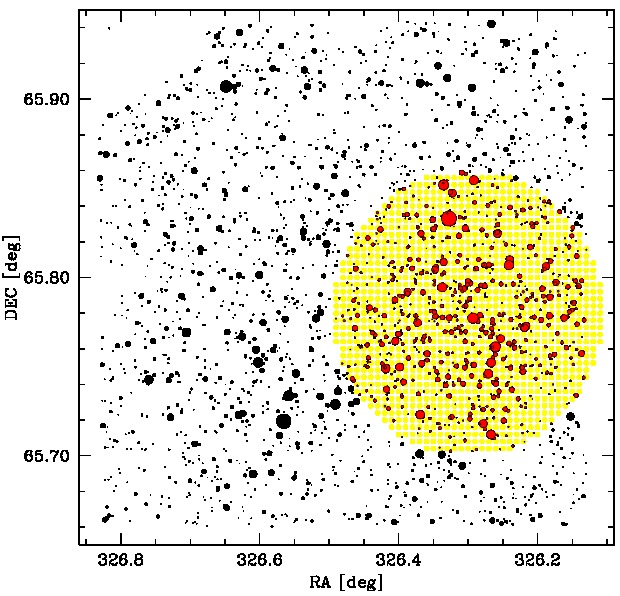
Figure 11 -
Overall map of the surveyed field across NGC 7142. The central spot
locates the "inner" region of 5 arcmin radius surrounding the cluster center.
A bright star North-East to the cluster has been masked (see Fig. 1) thus
preventing accurate photometry in the relatively close region.
|
|
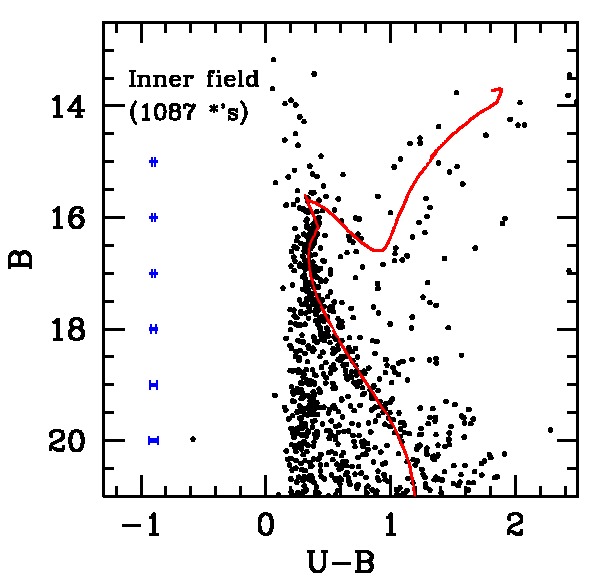
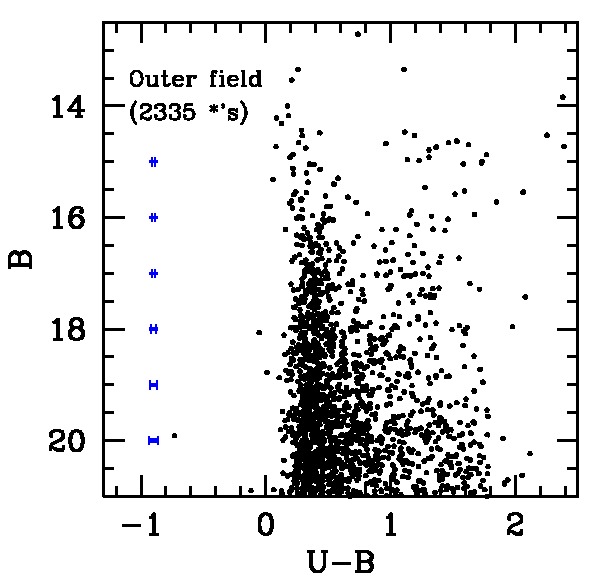
Figure 12a,b -
Same as for Fig. 9, but for cluster NGC 7142. In order to enhance cluster
visibility, the upper panel collects photometry for 1087 stars brighter than B = 24.0
in an "inner" region within 5 arcmin from cluster fiducial center, as in the map of
Fig. 11, while the field distribution in the "outer" region (2335 stars) is displayed in the lower panel.
A match is attempted in the upper panel with a 4 Gyr Padova isochrone Bertelli et al. (2008) for
(Z, Y) = (0.04, 0.30). An apparent B distance modulus (m-M)B = 12.0 mag and
a color excess E(U-B) = 0.10 is assumed to rescale models.
For both panels, typical error bars for our photometry at the
different magnitude levels are displayed on the left.
|
|
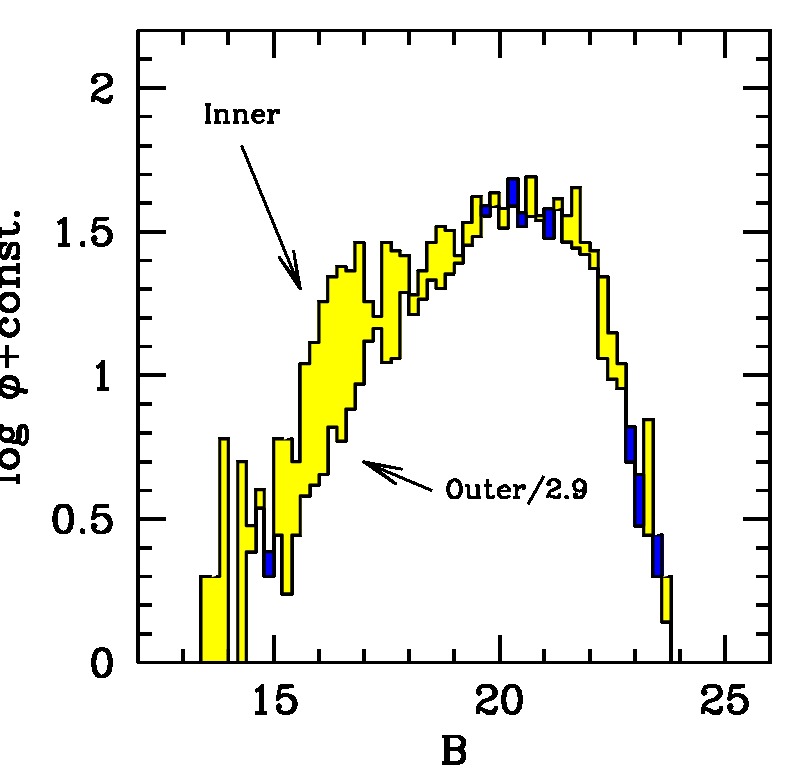
Figure 13 -
Same as for Fig. 10, but for cluster NGC 7142.
Again, to consistently compare the "outer" and "inner" areas, star counts
in the external region have been rescaled by a factor of ~2.9, as labelled in the plot.
|
|
Figure 14 -
Field realizations along the line of sight of NGC 6791, 6819 and 7142
simulated by means of the Girardi et al. (2005) Galactic model.
The synthesis output has been scaled throughout to an area of 0.06 square deg in order to
consistently match the observed stellar sample of our "outer"-field regions
(as in the maps of Fig. 8 and 11, for instance).
The syhntetic CMDs are displayed in the left panels, while the corresponding B-band luminosity
function are computed in the right panels, and compared with our "outer" observations on a
similar area of the clusters (thick-line histograms).
Color code in the synthetic CMDs is red for halo stars, green for the thin disk,
and blue for the thick disk. Note, all the way, the prevailing contribution of
thick-disk stars to the coarse Galactic field.
|
|
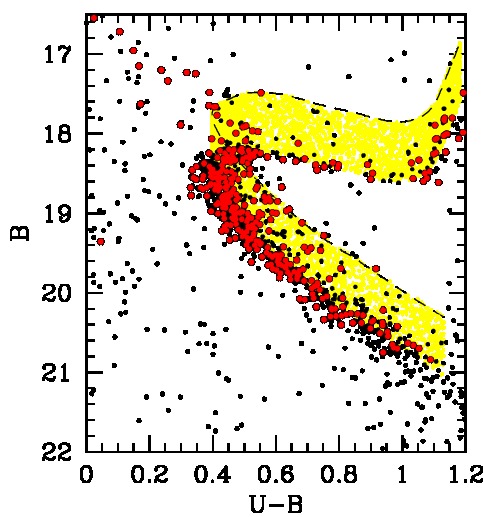
Figure 15 -
A zoomed-in CMD of NGC 6791 around the MS turn-off region.
Only stars in our catalog within a 2.5 arcmin radius from cluster center have
been considered, in order to minimize the field-star contamination.
According to Cudworth (2008, private communication, as cited by Twarog et al. (2011)
stars with membership probability Pm ≥ 80%
have been marked by big red dots. Dashed
curve is the MS fiducial locus shifted toward 0.75 mag brighter luminosities
such as to edge any MS+MS star pair in case of unresolved binary systems.
See text for details.
|
Back to article listing |
|
Shortcut to the SSP models |
| AB/Jun 2014 |
|
|