Back to article listing

Back to article listing |
|
Shortcut to the SSP models |
| Buzzoni, A.: |
| "Photometric entropy of stellar populations and related diagnostic tools", |
| 2005, Proc. of "Resolved Stellar Populations", eds. D. Valls-Gabaud & M. Chavez, ASP Conf. Ser. (ASP: San Francisco), in press |
|
Summary:
We discuss, from a statistical point of view, some leading issues that deal with the study of
stellar populations in fully or partially unresolved aggregates, like globular clusters and
distant galaxies.
A confident assessment of the effective number and luminosity of stellar contributors
can provide, in this regard, a very useful interpretative tool to properly assess the observational
bias coming from crowding conditions or surface brightness fluctuations.
These arguments have led us to introduce a new concept of "photometric entropy"
of a stellar population, whose impact on different astrophysical aspects of cluster diagnostic
has been reviewed here.
|
 |
| Pick up the paper at Astro-ph/0509602 | Local gzipped Postscript version (518Kb) |
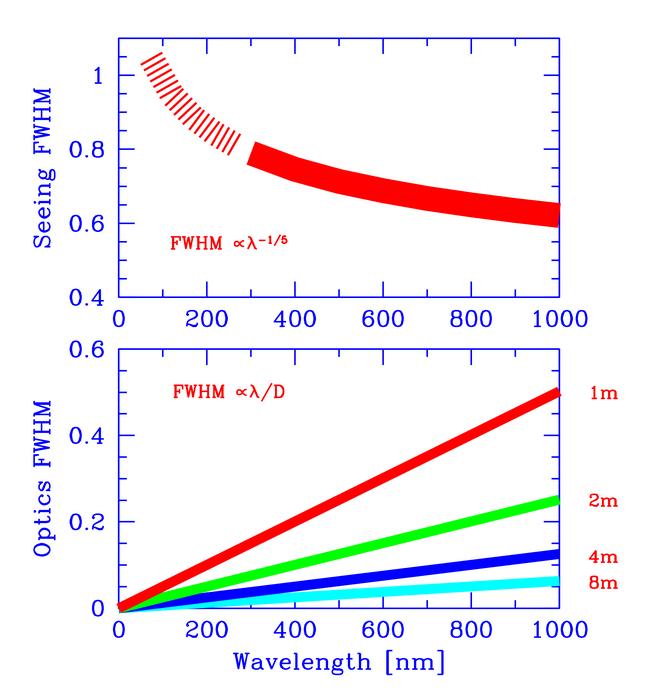 |
Fig. 1 - Upper panel: The expected trend of seeing variation
with varying wavelength, after Wynne (1999). From empirical estimates and theoretical arguments,
the FWHM of the seeing disk is found to scale approximately as
FWHMseeing = k λ-1/5.
Lower panel: Telescope resolving power with varying the aperture
diameter, D, (right labels, in meters). As predicted by the classical Airy diffraction pattern,
FWHMAiry = k λ/D. Contrary to seeing, optics performance degrades when
moving to long-wavelength photometric bands.
|
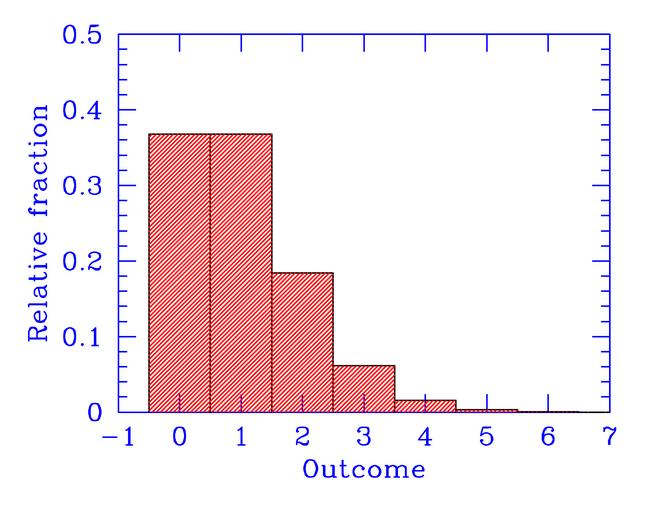 |
Fig. 2 - The Poissonian distribution of the Ntot star cells
in our "fair statistical representation" of a stellar population. In average, each cell contains
one star, according to the Poisson formula, p(x) = e-1/x!.
As a consequence, after repeated trials, the total number of stars, Ntot,
is expected to fluctuate by σ(Ntot) = Ntot1/2.
|
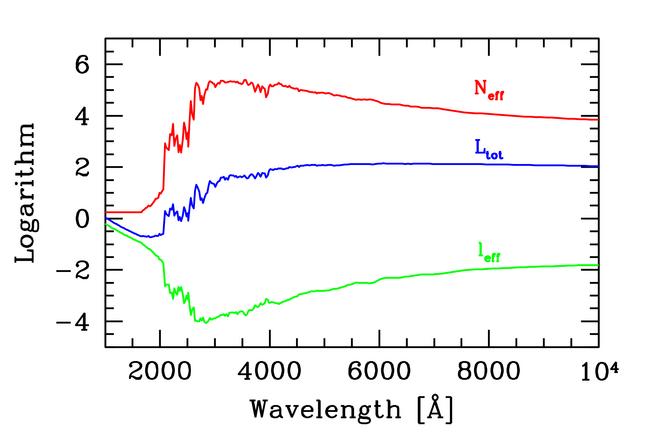 |
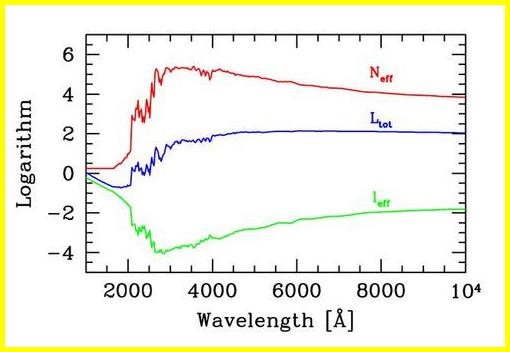
Fig. 3 -
Logarithm of effective luminosity (leff) and star number
(Neff) for a 15 Gyr SSP of solar metallicity and Salpeter IMF, from
Buzzoni (1993).
Both quantities relates to the global luminosity (Ltot) of the stellar population
through eq. (10). The model has been rescaled to a total SSP bolometric luminosity
of 107Lsun.
|
|
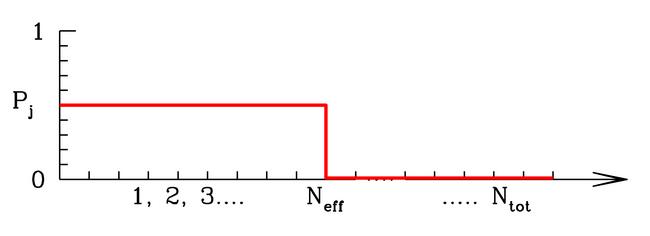
Fig. 4 -
A schematic representation of Neff, defined in our statistical experiment as the
maximum number of "switched-on" cells, each containing one star of fixed luminosity
leff, such as to provide the total observed luminosity of the population,
Ltot, at a given photometric band.
|
|
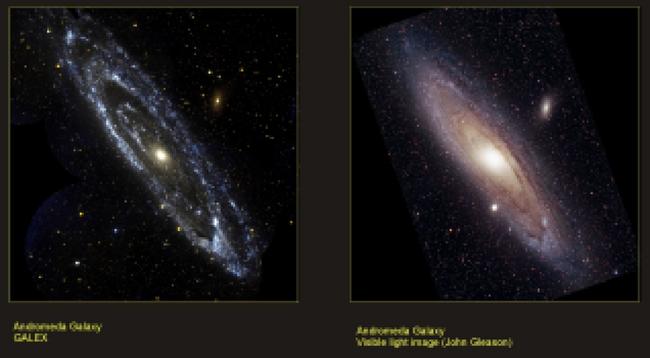
Fig. 5 -
The centermost 3o x 3o region of the Andromeda galaxy (M 31),
as imaged by the ultraviolet space telescope GALEX (Thilker et al. 2005) between 1500 and
3000 Å (left panel), and seen
at optical wavelength (right panel).
The image is courtesy of the GALEX scientific team, and made
available at the Project Web site. It is evident the
increased "transparency" of the galaxy at ultraviolet wavelength, as a consequence of
a drastically lower number of effective stellar contributors. See text for a discussion.
|
|
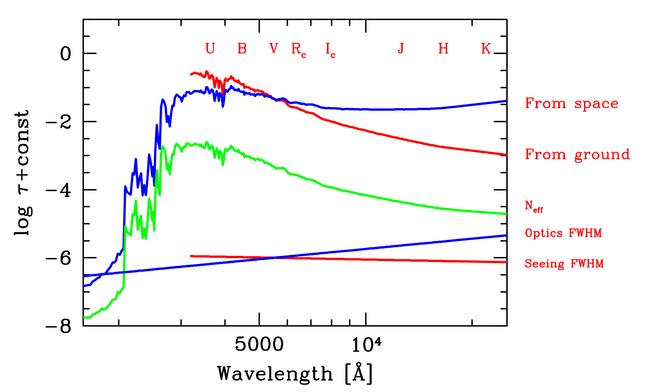
Fig. 6 -
The apparent system opacity (τ) in case of a SSP as
in Fig. 3, assuming to observe the stellar sample from ground and from space (upper curves).
Crowding conditions are mainly modulated by seeing, in case of ground-based observations
with conventional telescopes, and by the telescope diffraction limit in case of space imaging.
Note that calculations for ground-based observations have been stopped shortward of
3000 Å given the atmosphere opacity. In addition, the two curves have been offset by an
arbitrary quantity in the logarithm domain to match at the V band.
Due to an opposite trend of seeing and optics FWHM (see the two curves at the bottom, as
labeled), the convolution with the apparent surface density of stars (Neff curve)
leads to different performance outputs. In particular, ground-based observations
sensibly improve when moving at longer wavelength, thanks to a more favorable seeing
condition, while crowding conditions are expected to maintain roughly constant at the
different photometric bands in case of space observations. The Johnson/Cousins photometric
band system is reported at the top of the figure, as a reference.
|
|
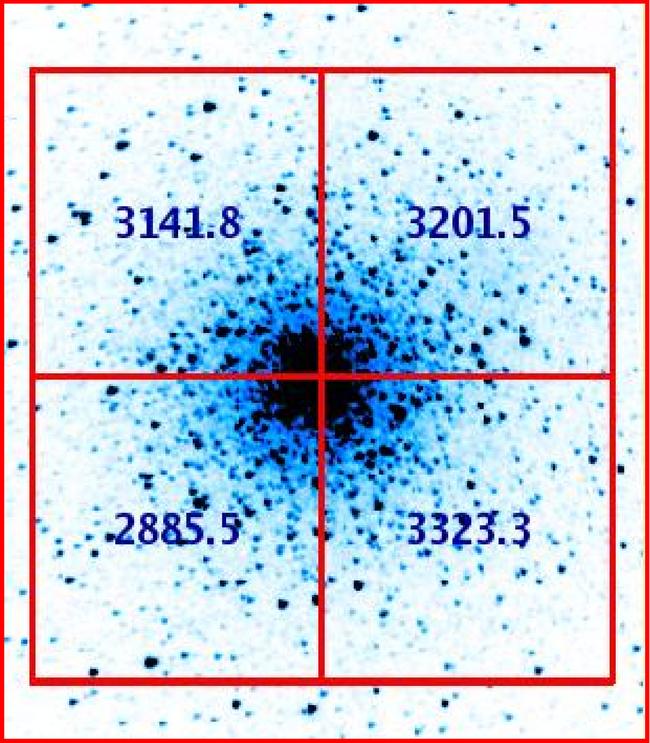
Fig. 7 -
An illustrative example of surface brightness fluctuations in the globular clsuter M 53
(alias NGC 5024). The Rc-band frame has been taken at the 2.12m telescope of
Cananea (Mexico) with a FOSC camera. Field is roughly 6.5 arcmin x 6.5 arcmin
sampled with a 1 arcsec pixel size of
on the sky. For our experiment, the cluster has been divided in four quadrants reporting
the sky-subtracted integrated CCD counts for each partition, as labeled on the plot. See text for
discussion.
|
|
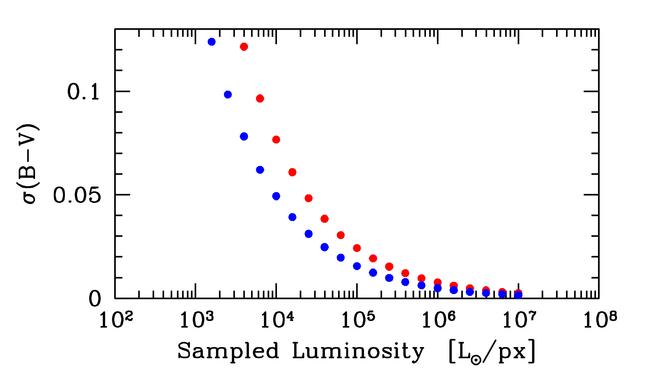
Fig. 8 -
The expected statistical scatter in the galaxy B-V color versus pixel luminosity sampling.
The scatter amount ranges according to eq. (19). High-S/N (i.e. S/N » 100)
high-resolution galaxy imagery could in principle detect the effect.
|
|
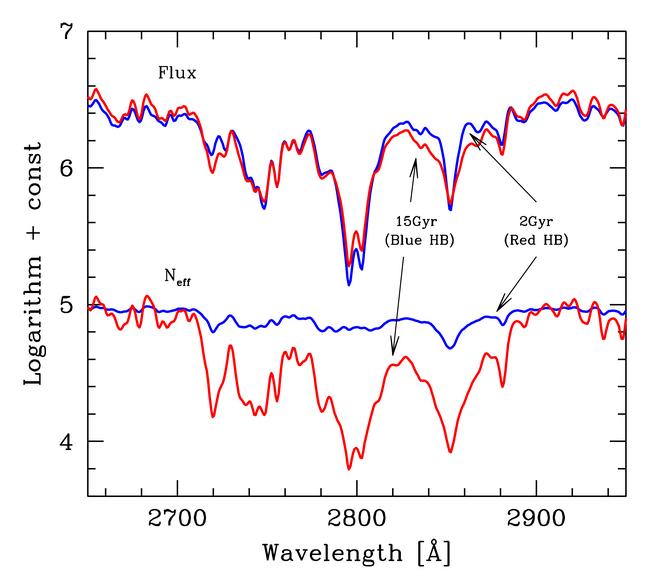
Fig. 9 -
Theoretical spectral energy distribution (upper plots) and effective stellar
contributors (Neff) (lower plots) for two SSPs of solar metallicity and Salpeter
IMF according to Buzzoni (1989,
1993) population synthesis models.
The models refer to a 2 Gyr SSP with red HB morphology, and a 15 Gyr population
with blue HB, as labeled. The new UVBLUE
theoretical library of spectra (Rodriguez-Merino et al. 2005)
has been used to reproduce the spectral region around the striking MgII and MgI features,
about 2800 Å. In spite of a substantially indistiguishable difference between the
spectra, the two SSPs display a large difference in terms of effective contributors and photometric entropy,
with a much higher statistical scatter in the spectral features expected for the older SSP.
|
Back to article listing |
|
Shortcut to the SSP models |
| AB/Sep 2005 |
|
|