Back to article listing

Back to article listing |
|
Shortcut to Space Stuff |
| Buzzoni, A.: |
| "Lick-index entanglement
and biased diagnostic of stellar populations in galaxies", 2015, MNRAS, 449, 296 |
|
|
Summary:
The Lick-index spectrophotometric system is investigated in its inherent statistical and
operational properties to ease a more appropriate use for astrophysical studies.
Non-Gaussian effects in the index standardization procedure suggest
that a minimum S/N ratio has to be reached by spectral data, such as S/N ≥5 px−1
for a spectral resolution R ~2000. In addition, index (re-)definition in terms of narrow-band
"color" should be preferred over the classical pseudo-equivalent width scheme. The overlapping wavelength range among different indices is also an issue, as it may lead the latter ones to correlate, beyond any strictly physical relationship. The nested configuration of the Fe5335, Fe5270 indices, and the so-called "Mg complex" (including Mg1, Mg2 and Mgb) is analysed, in this context, by assessing the implied bias when joining entangled features into "global" diagnostic meta-indices, like the perused [MgFe] metallicity tracer. The perturbing effect of [OIII]5007 and [NI]5199 forbidden gas emission on Fe5015 and Mgb absorption features is considered, and an updated correction scheme is proposed when using [OIII]5007 as a proxy to appraise Hβ residual emission. When applied to present-day elliptical galaxy population, the revised Hβ scale leads, on average, to 20-30% younger age estimates. Finally, the misleading role of the christening element in Lick-based chemical analyses is illustrated for the striking case of Fe4531. In fact, while Iron is nominally the main contributor to the observed feature in high-resolution spectra, we have shown that the Fe4531 index actually maximizes its responsiveness to Titanium abundance. |
| Pick up the paper at Astro-ph/1502.02672 | Local link to the PDF version (1.2 Mb) (for personal use only) |
||
|
Enhanced HTML/PDF version at the MNRAS site (may require access password) |
|
|
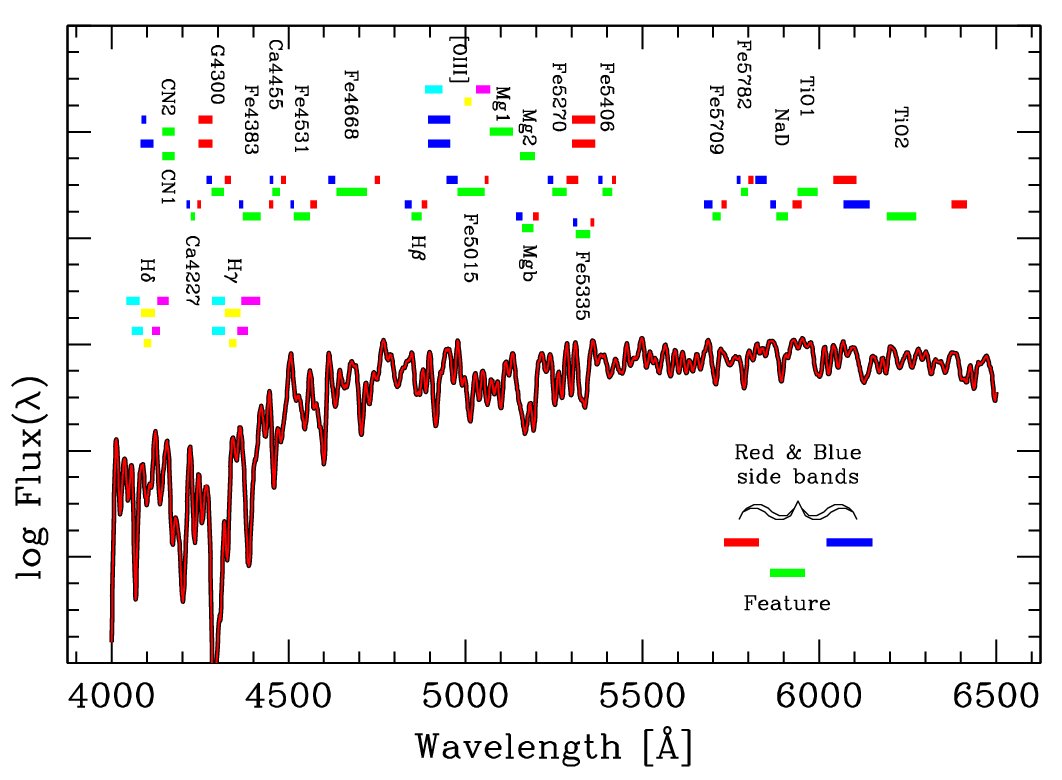
Figure 1 -
A global view of the Lick-index wavelength distribution. The original set of 21 indices (Worthey et al. 1994)
has been complemented by the four Worthey & Ottaviani (1997) new Balmer indices (namely,
Hδ and Hγ, in their
"wide" and "narrow" version) and the Gonzalez (1993) [OIII] index, as labelled in the plot.
The index map is superposed to a synthetic stellar spectrum with
[Teff,log g, Z] = [4750 K, 2.00, Zsun
from the BLUERED theoretical
library (Bertone et al. 2004, 2008), degraded to match the Lick spectral
resolution of 8.5 Å FWHM.
|
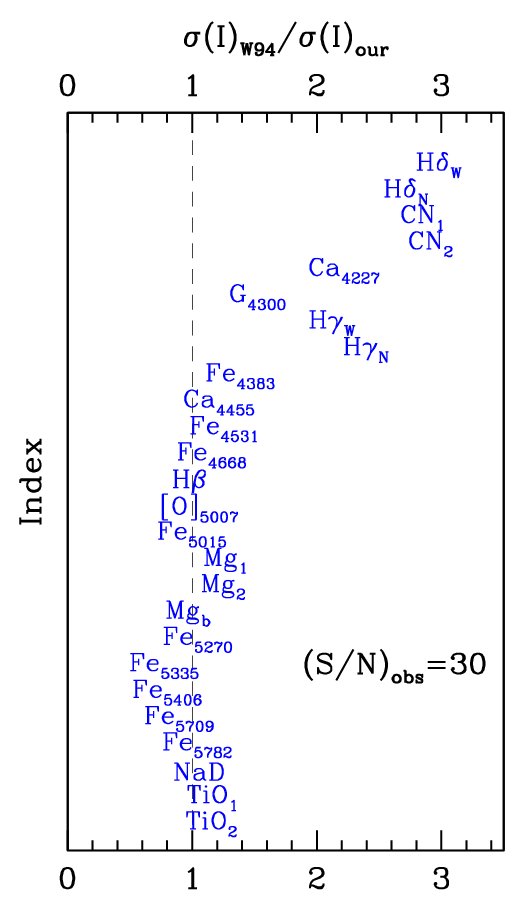
| Figure 2 -
The expected index standard deviation σ(I)our, according to eq. (20),
for an assumed spectral S/N ~30 is compared with the empirical estimate from the Lick primary
calibrators, as from Table 1 of Worthey (1994) and Worthey & Ottaviani (1997).
The uncertainty for [OIII]5007 has been estimated from the Gonzalez (1993) data, as
from Table 4.1 therein, by scaling down
his figures to S/N = 30. Notice that Lick IDS spectra lack any stable intensity response,
a feature that prevents any firm assessment of the S/N ratio of the original data
(Faber & Jackson 1976; Worthey et al. 1994).
A remarkably good agreement is found, however, with our theoretical predictions, as far as "red" indices
(about λ≥4350 Å) are concerned. A notable worsening in the Lick calibration accuracy
is evident at shorter wavelength, likely due to poorer detector performance and statistical drawbacks
inherent to index definition, as discussed in the text.
|
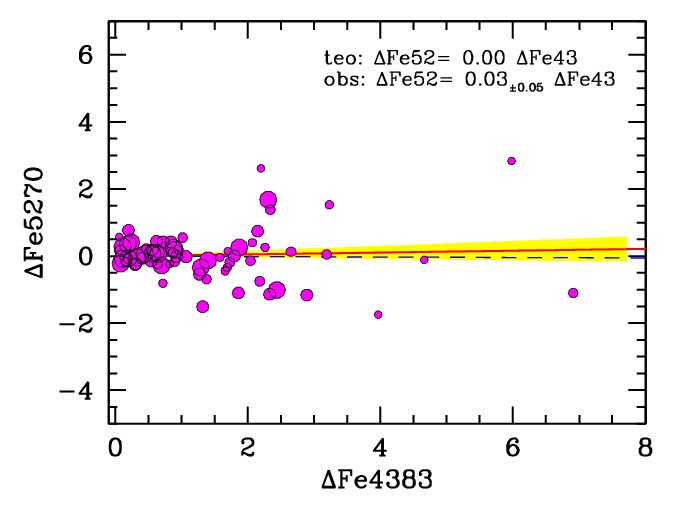 |
Figure 3 -
The envisaged Δ-Δ test among galaxy spectroscopic indices in the
Buzzoni et al. (2009b, 2015) galaxy sample (see text for details)
is explained here for the illustrative case of Fe4383 (index "x") and Fe5270 (index "y").
If we assume the source of "left − right" index
difference to be only of stochastic nature, then no correlation has to be expected between
ΔFe4383 and ΔFe5270.
A least-square linear fit to the data, in the form
of Δ y = α Δ x, actually provides α = 0.03±0.05 (solid line with
the yellow fan marking the ± 1 σ standard deviation of the slope estimator), fully
consistent with a flat trend (dashed line), as expected for
this case. Just as a guideline, notice that the dot size in the plot is smaller for index
measurements at farther radial distances from galaxy center.
|
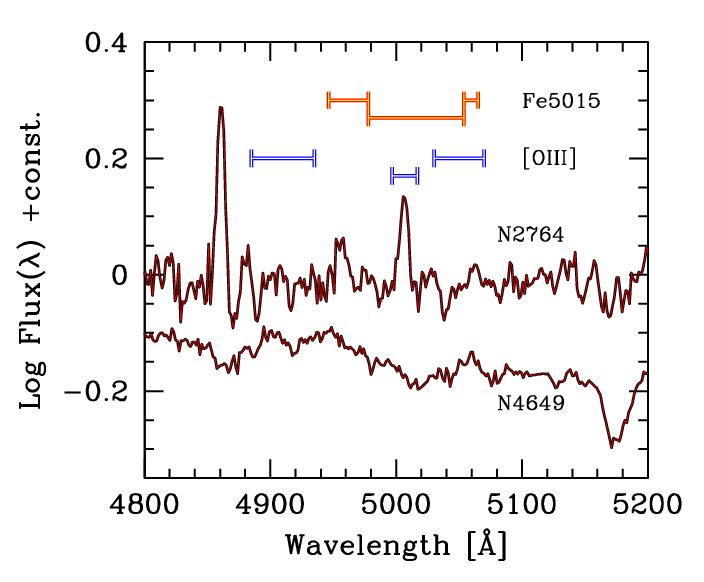 |
Figure 4 -
The nested configuration of the [OIII]5007 and Fe5015 indices. For each index the
two blue and red pseudo-continuum sideband are reported, flanking the main
feature window. Two representative spectra of active (NGC 2764) and quiescent (NGC 4649)
elliptical galaxies, from our observed database (Buzzoni et al. 2009b), are superposed to the index sketch,
for the sake of comparison. In addition to the [OIII] emission, note for NGC 2764
also a prominent Hβ emission at the nominal λλ 4861 Å.
|
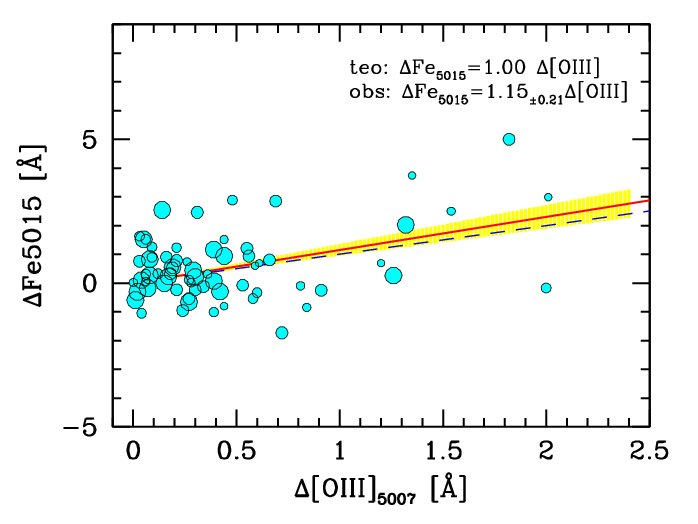 |
Figure 5 -
The Δ-Δ correlation test, as for Fig. 3, for the [OIII]5007
and Fe5015 indices. The expected statistical prediction, according to eq. (28)
(dashed line), is well matched by the observations, the latter ones providing a fully consistent
α = 1.15±0.21 fitting line slope (solid line within a ±1 σ yellow fan),
as reported top right in the plot.
|
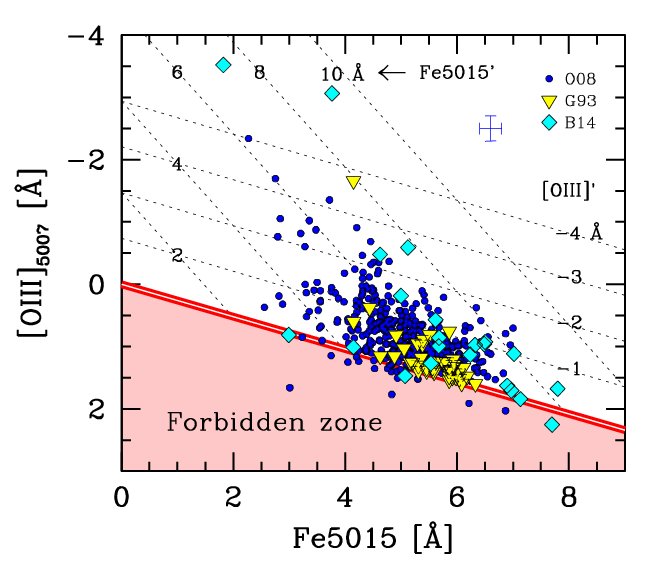 |
Figure 6 -
The observed (raw) [OIII]5007 versus Fe5015 index distribution for the
Ogando et al. (2008) (solid dots), Gonzalez (1993) (triangles) and Buzzoni et al. (2009b, 2015)
(rombs) samples of early-type galaxies. The forbidden zone in the index domain
is shaded, according to eq. (31), while a more general parameterization
versus intrinsic Fe5015 and [OIII]5007 strength (primed indices in the plot)
is displayed, in force of eq. (27) and (31).
An indicative error box for the observations is reported top right.
|
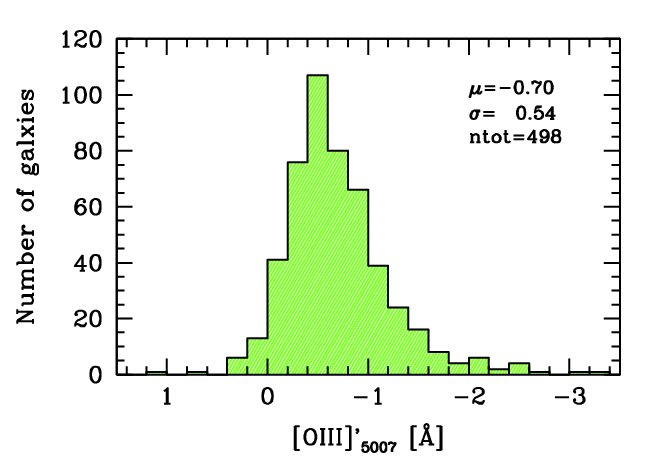 |
Figure 7 -
The [OIII]5007 distribution of the intrinsic ("primed") index among
the Ogando et al. (2008) early-type galaxy sample. A total of 498 galaxies,
with available [OIII]5007 and Fe5015 observations are displayed.
The [OIII] observations have been corrected according to eq. (31).
On average, ellipticals display a weak residual gas emission with
<[OIII]'5007> = −0.70±0.54 Å. For a fraction of 21%
of the total sample, the intrinsic [OIII] pseudo-equivalent width is in excess
of 1 Å, while about 1/7 of these galaxies (16 out of 498) display a striking
(star-formation) activity, with [OIII]'5007≤ −2 Å.
|
|
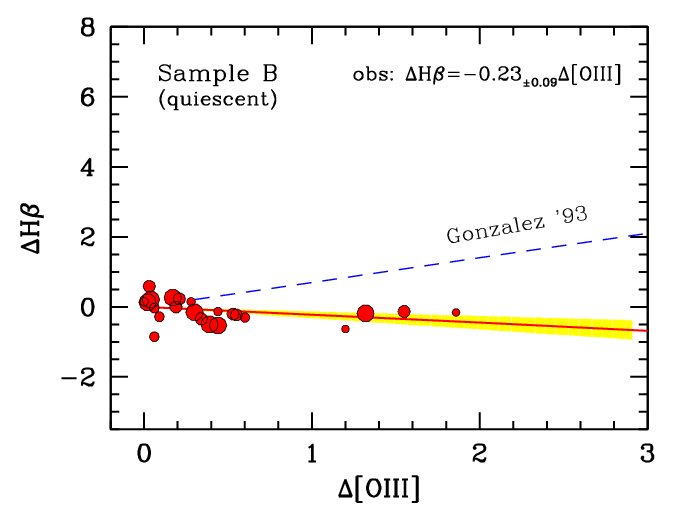
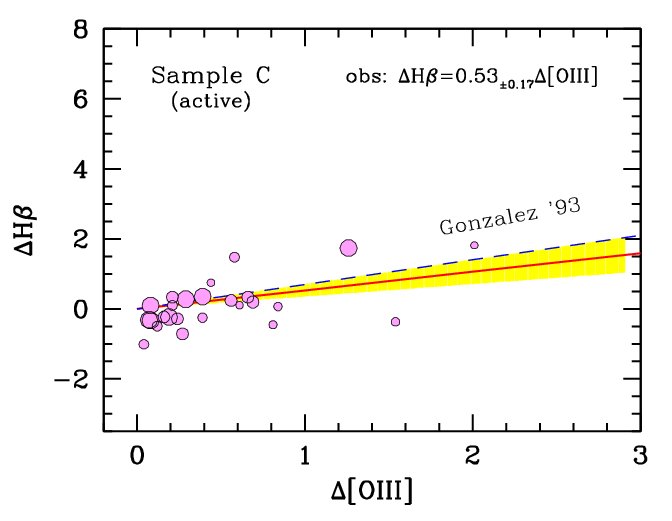
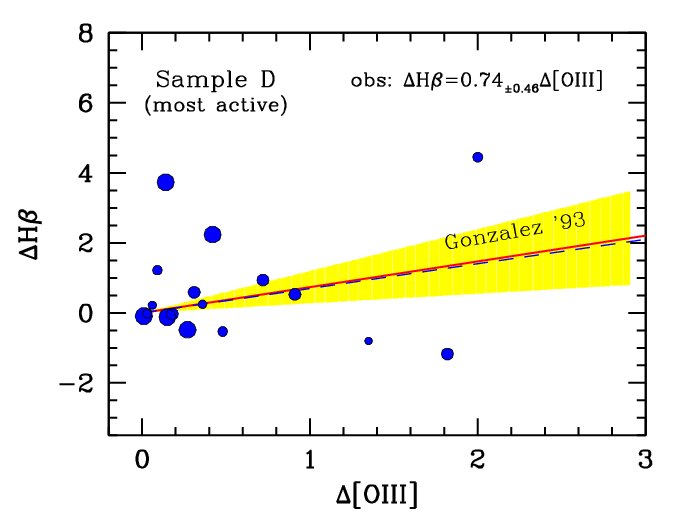
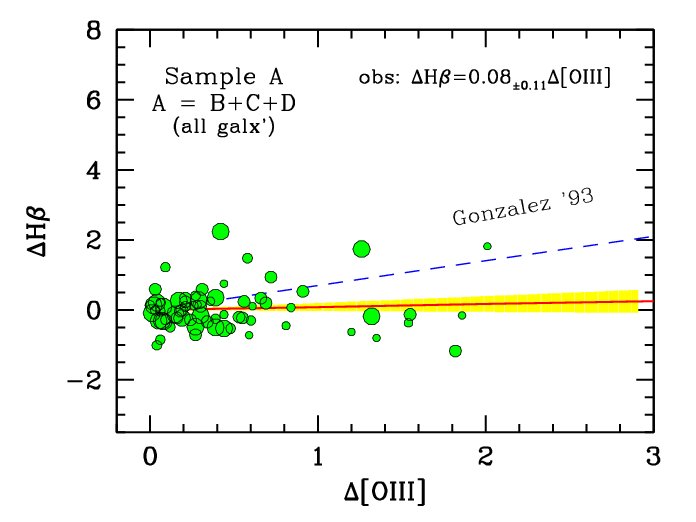
Figure 8a,b,c,d -
The Δ-Δ correlation test, as for Fig. 3, for the [OIII]5007
and Hβ indices in the adopted Buzzoni et al. (2009b, 2015) sample of early-type galaxies.
The whole Sample "A", of the 20 objects (upper panel), is split into three groups
(i.e. Samples "B", "C" and "D", from top to bottom) consisting, respectively of
7, 8, and 5 galaxies with increasing gas emission activity. Groups have been assembled according
to the asterisk ranking of Table 1, that combines the Bettoni & Buson (1987)
empirical classification with the [OIII] index strength in our observations.
The dashed line, in each plot, marks the Gonzalez (1993) Δ-Δ correction slope.
Our least-square fit is reported top right in each panel, and displayed (solid line) together
with its corresponding ±1 σ uncertainty (yellow fan). Our output is summarized
in Table 3.
|
|
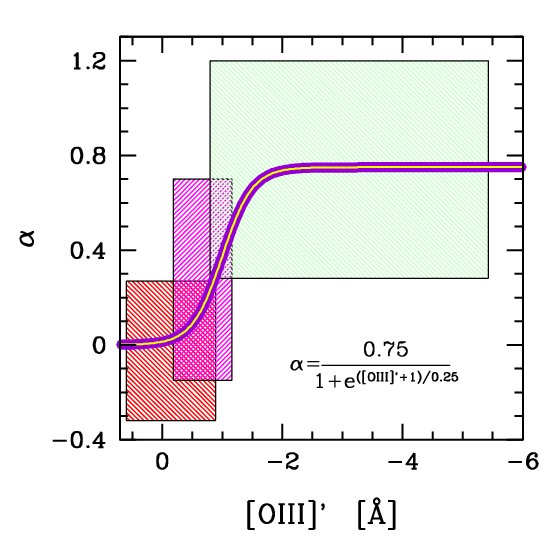
Figure 9 -
The devised correction scheme for Hβ in the form of a logistic curve versus intrinsic
[OIII]' emission, as from eq. (33). The "quiescent", "active" and "most active"
galaxy samples of Fig. 8 are sketched by the three shaded boxes, with [OIII]' mean
central values and α error bars as from Table 3.
|
|
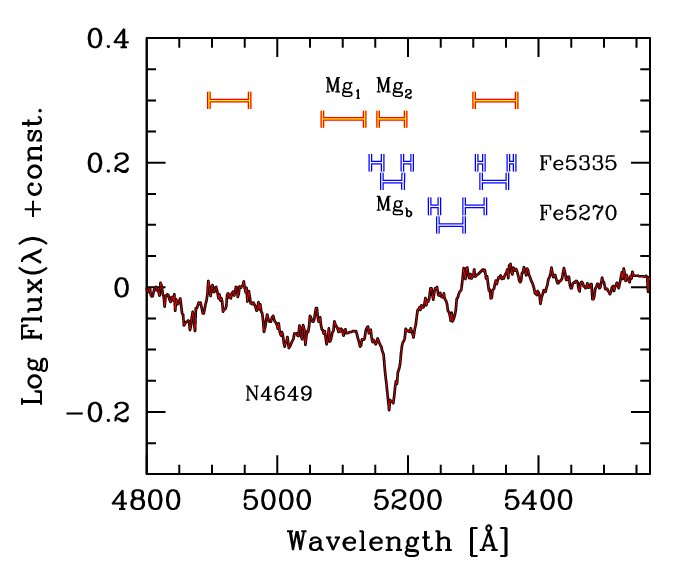
Figure 10 -
An illustrative sketch of the Mg index set, and the two Fe5270 and Fe5335 indices.
For each index, the blue and red sidebands are marked, flanking the relevant feature window.
The nested configuration of the Mgb, Fe5335 and Mg2 indices is well evident, as discussed
in the text. The representative spectrum of the elliptical galaxy NGC 4649
(from the Buzzoni et al. 2009b data) is superposed for the sake of comparison.
|
|
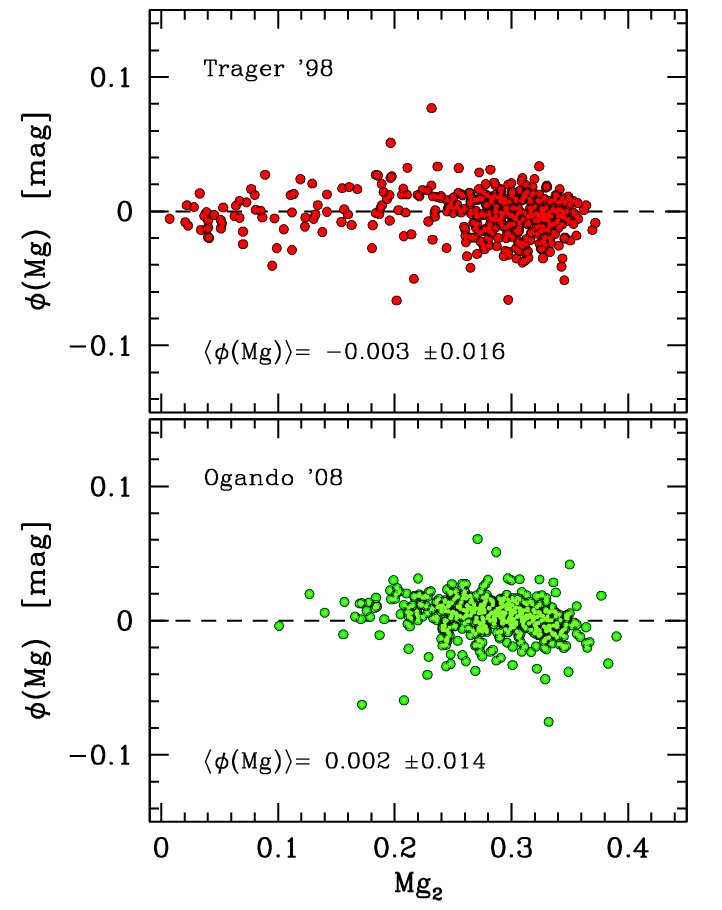
Figure 11 -
An empirical check of the expected relationship among the three popular Mg indices sampled by the Lick system.
The synthesis function φ(Mg) of eq. (39) has been scrutinized by means of the two extended
early-type galaxy samples of Trager et al. (1998) (406 galaxies with complete Mg1,
Mg2 and Mgb data,
see upper panel), and Ogando et al. (2008) (481 galaxies, lower panel). The match with both samples
allowed us to obtain the fine-tuning offset in the theoretical relationship, such as k = 0.03 mag.
After offset application, notice for both plots the lack of any drift in the point distribution, a
feature that assures the correct parameterization of our theoretical relationship. In addition, the
point scatter around the zero line indicates that index mutual relationship can be obtained within
a ~1.5% internal accuracy.
|
|
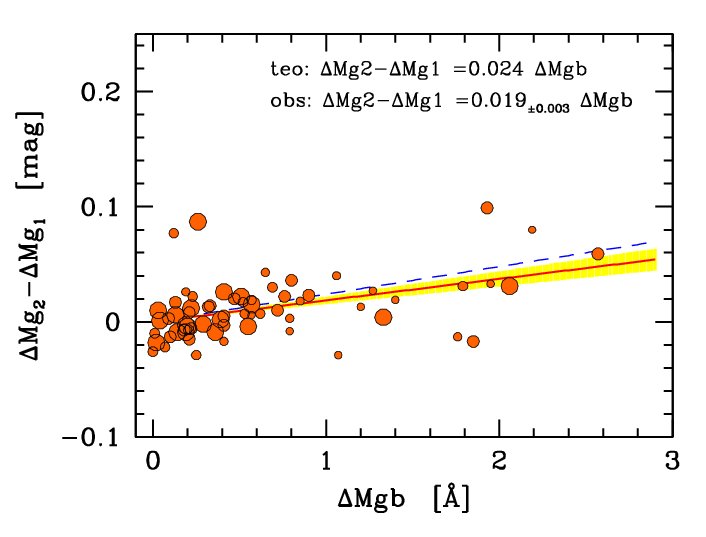
Figure 12 -
The Δ-Δ correlation test, as for Fig. 3, for the Mg index complex.
The ΔMg1, ΔMg2 and ΔMgb variation across the
Buzzoni et al. (2009b, 2015) galaxy sample of Table 2 is probed in terms of the expected relationsip,
as from eq. (40) (dashed line in the plot).
Our least-square fit is reported top right, and displayed (solid line) together
with its corresponding ±1 σ statistical uncertainty (yellow fan).
|
|
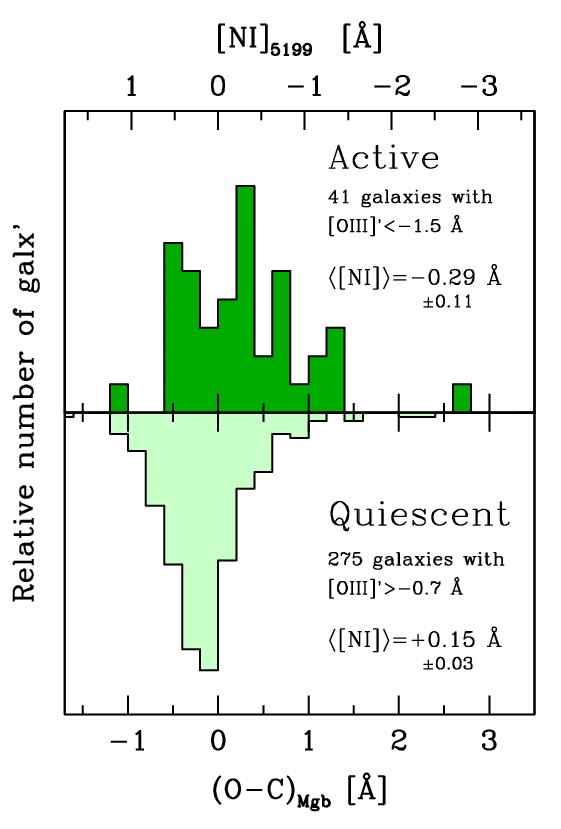
Figure 13 -
The inferred distribution of the "hidden" [NI]5199 gas emission in the Ogando et al. (1998)
galaxy sample. In case of intervening [NI] emission, the Mgb index is expected to enhance, on average,
by the amount of eq. (43) with respect to its theoretical figure, as from eq. (38).
This excess (in the sense "Observed − Computed", see lower x axis), and the related [NI] strength
(upper x axis) is probed by contrasting the
subsample of 41 "active" galaxies (as traced by explicit [OIII] emission
stronger than 1.5 Å, as in the upper histogram) with the population of 275 "quiescent" galaxies
with vanishing [OIII] (see the lower histogram). See text for a discussion.
|
|
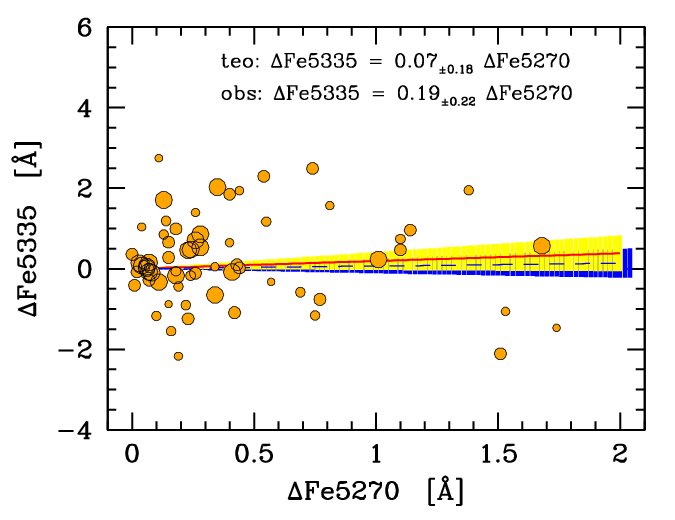
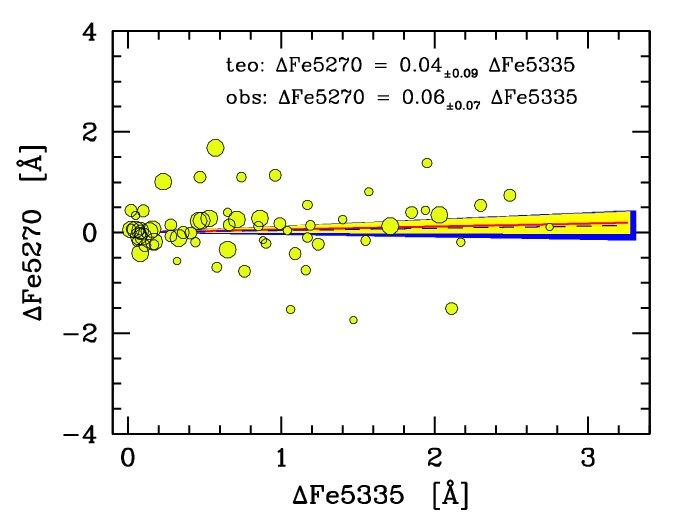
Figure 14a,b -
The Δ-Δ correlation test, as for Fig. 3, for the Fe5270 and Fe5335 indices.
The low correlation between index variation, as predicted by eq. (48) and (51)
(dashed lines in the two plots, with their corresponding ±1 σ Bayesian uncertainties,
as from the blue fans) is consistently resumed by our observing test on the
galaxy sample of Table 2 (solid lines with their corresponding ±1 σ statistical
uncertainties, as from the yellow fans). See text for a discussion.
|
|
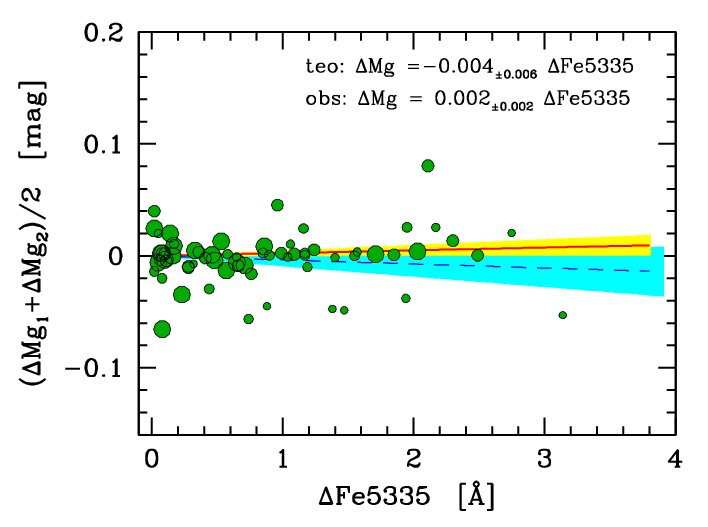
Figure 15 -
The Δ-Δ correlation test, as for Fig. 3, for the Fe5335 and Mg indices.
The observed relationship for Mg1 and Mg2 is averaged, to gain a cleaner view of the
effect. In spite of the average low correlation, as predicted by eq. (56)
(dashed line) one has to notice the important Bayesian uncertainty (blue fan in the plot,
tracing the ±1 σ uncertainty), which makes the bias effect of Mg-Fe5335 entanglement
possibly of non-negligible impact on individual galaxies.
|
|
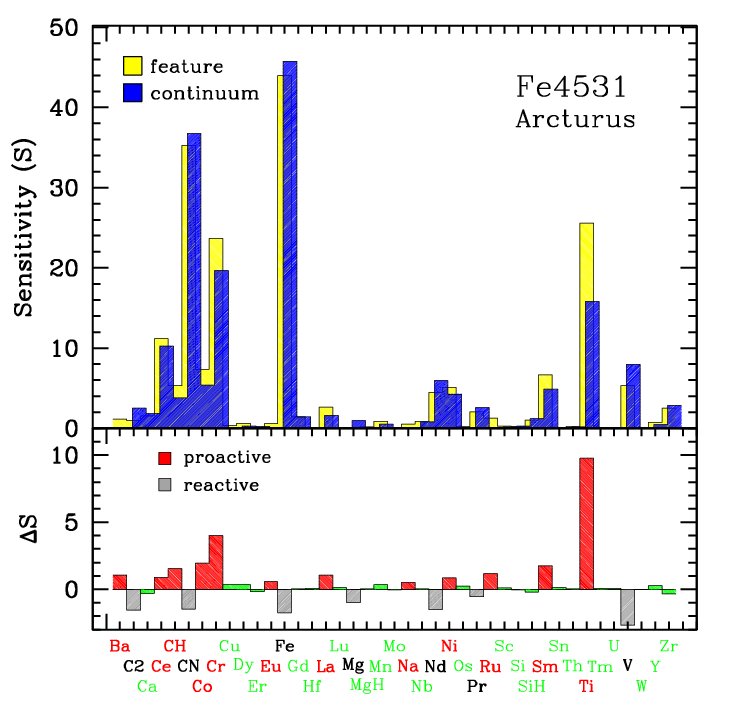
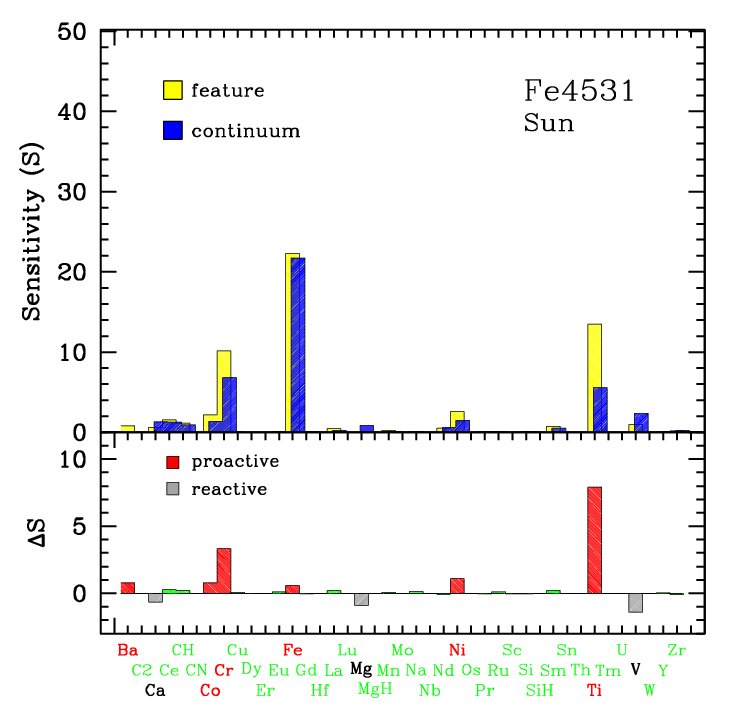
Figure 16a,b -
The Fe4531 index sensitivity to the 40 most prominent chemical elements (as sequenced in the x axis,
disregarding their ionization states) in the Sun (left panel) and Arcturus (right panel) spectrum.
In both panels, the yellow histograms refer to the elemental contribution (SfX)
to the feature window, according to the definition of eq. (57), while the blue histograms
are for the elemental contribution (ScX) to the flanking pseudo-continuum index
sidebands, according to eq. (58). The net contribution to the index strength
(Δ SX), as from eq. (59), is displayed in the lower plots, where "proactive"
elements are displayed in red and "reactive" elements in grey.
Note the leading role of Titanium and the reactive action of Vanadium and Magnesium.
See text for a full discussion.
|
|
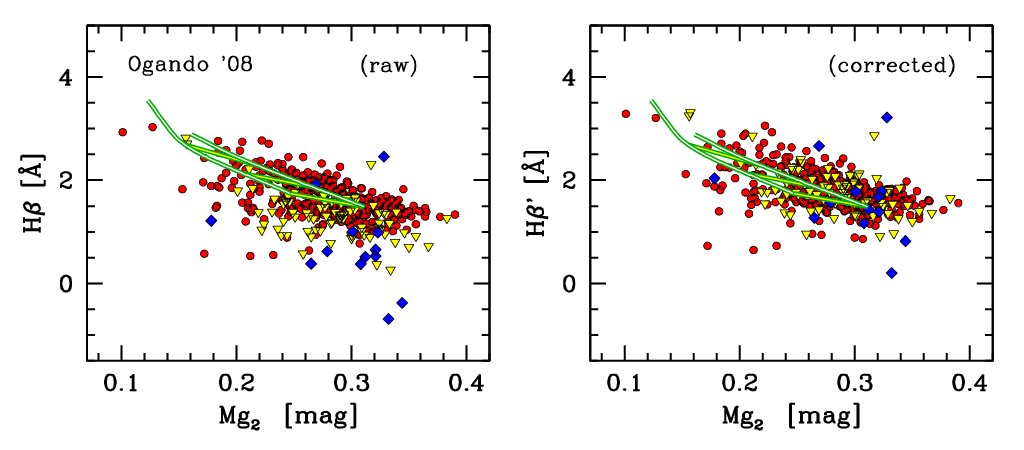
Figure 17 -
The devised scheme for Hβ correction, as in Fig. 9, is applied to the Ogando et al. (2008)
early-type galaxy sample, displayed in the Hβ versus Mg2 index plane. The strength
of Hβe gas emission is sized up and subtracted according to eq. (34),
taking the observed [OIII]'5007 emission as a proxy. To better appreciate the correction
effect, we adopted three different galaxy markers for nearly "quiescent" (i.e.
[OIII]'5007 > −1 Å, or
Hβe > −0.4 Å,
solid dots), "moderately active" (−2 ≤ [OIII]'5007 ≤ −1 Å,
or −1.5 ≤ Hβe ≤ −0.4 Å, triangles),
and "active" (i.e. [OIII]'5007 < −2 Å or
Hβe ≤ −1.5 Å, rombs)
galaxies. As a guideline, in both panels we also displayed the Buzzoni, Mantegazza & Gariboldi (1994)
synthesis models for a standard Salpeter IMF and [Fe/H] metallicity parameter
between −0.25 (upper line) and +0.22 dex (lower line). "Ladders" across model sequences tick
galaxy age for values of 2, 5, 10, and 15 Gyr, with increasing Mg2.
After correction (right panel), galaxy Hβ index is increased, on average, by
0.25 ±0.20 Å along the whole sample, making galaxies to appear,
on average, about 20-30% younger and 0.2-0.3 dex metal poorer.
|
Back to article listing |
|
Shortcut to Space Stuff |
| AB/May 2017 |
|
|