Back to article listing

Back to article listing |
|
Shortcut to Space Stuff |
| Torres-Zafra, J., Cellone, S.A., Buzzoni, A., Andruchow, I., Portilla, J.G.: |
| "Redshift determination of the BL Lac object 3C 66A by the detection
of its host galaxy cluster at z = 0.340" 2018, MNRAS, 474, 3162 |
|
|
Summary:
The BL Lac object 3C 66A is one of the most luminous extragalactic sources at TeV-rays
(VHE, i.e. E >100 GeV). Since TeV-ray radiation is absorbed by the extragalactic background
light (EBL), it is crucial to know the redshift of the source in order to reconstruct
its original spectral energy distribution, as well as to constrain EBL models. However, the
optical spectrum of this BL Lac is almost featureless, so a direct measurement of z is very
difficult; in fact, the published redshift value for this source (z = 0.444) has been strongly
questioned. Based on EBL absorption arguments, several constraints to its redshift, in the
range 0.096 < z < 0.5, were proposed. Since these AGNs are hosted, typically, in early type
galaxies that are members of groups or clusters, we have analysed spectro-photometrically
the environment of 3C 66A, with the goal of finding the galaxy group hosting this blazar. This
study was made using optical images of a 5.5x5.5 arcmin2 field centred on the blazar, and
spectra of 24 sources obtained with Gemini/GMOS-N multi-object spectroscopy. We found
spectroscopic evidence of two galaxy groups along the blazars line of sight: one at z~0.020
and a second one at z~0.340. The first one is consistent with a known foreground structure,
while the second group here presented has six spectroscopically confirmed members. Their
location along a red sequence in the colour-magnitude diagram allows us to identify 34 additional
candidate members of the more distant group. The blazars spectrum shows broad
absorption features that we identify as arising in the intergalactic medium, thus allowing us
to tentatively set a redshift lower limit at z3C66A ≥ 0.33. As a consequence, we propose that
3C 66A is hosted in a galaxy that belongs to a cluster at z = 0.340.
|
| Pick up the paper at Astro-ph/1710.04309 | Local link to the PDF version (1.0 Mb) | ||
|
Enhanced HTML/PDF version at the MNRAS site (*) (*) May require access password |
|
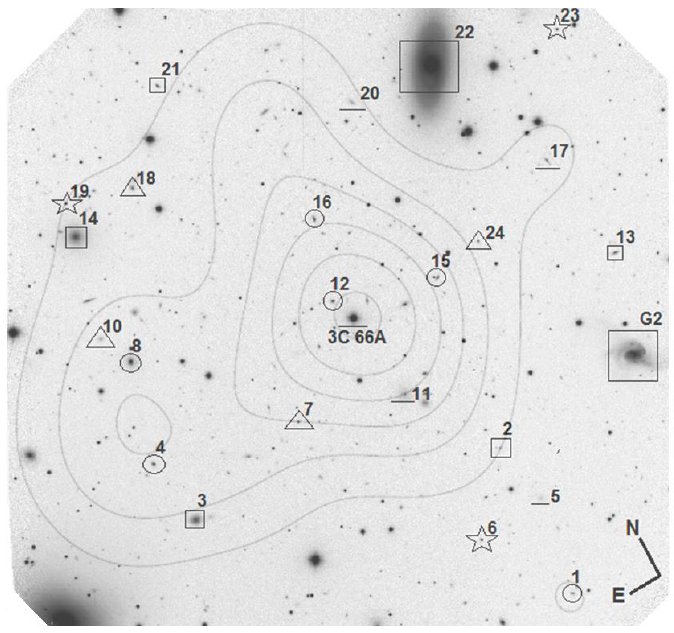
Figure 1 -
SExtractor classifier (CLASS_STAR) as a function of the apparent
magnitude i' of all the sources detected in the field of 3C 66A (green
circles). CLASS_STAR = 1: point sources; CLASS_STAR = 0: extended
sources. Galaxies detected in the field having FWHM > 8 pixels in the
i' band (plus the blazar, the i'~14 object with CLASS_STAR ~ 1) are
shown with red crosses.
|
|
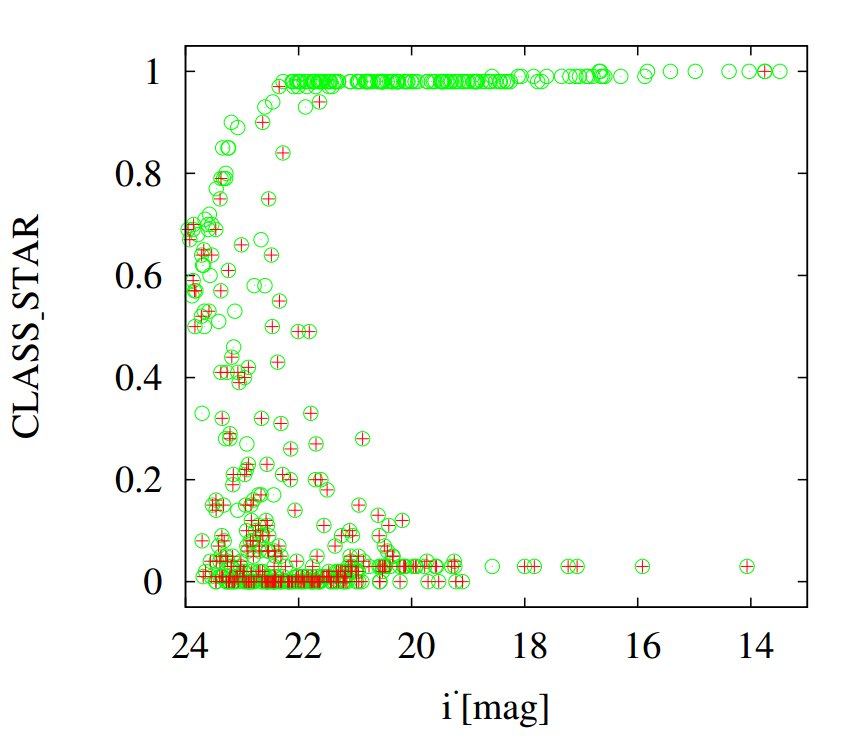
| Figure 2 -
GMOS i'-band image of the field centred on 3C 66A. Spectroscopically observed objects are labelled
following their slit number and marked according to their redshift (see Table 1), with respect to the detected
z = 0.340 group (see Section 3.1): triangles (z > 0.340), circles (z ~ 0.340), squares
(z < 0.340), star shape (Galactic stars), and straight lines underneath (objects with unknown redshift).
The large boxes mark galaxies G1 (slit #22) and G2 in Bowen et al.(1997). Contours show the projected
density of candidate members of the z = 0.340 group (see text). The frame is 5.5 arcmin on a side,
corresponding to 1.61 Mpc at z = 0.340.
|
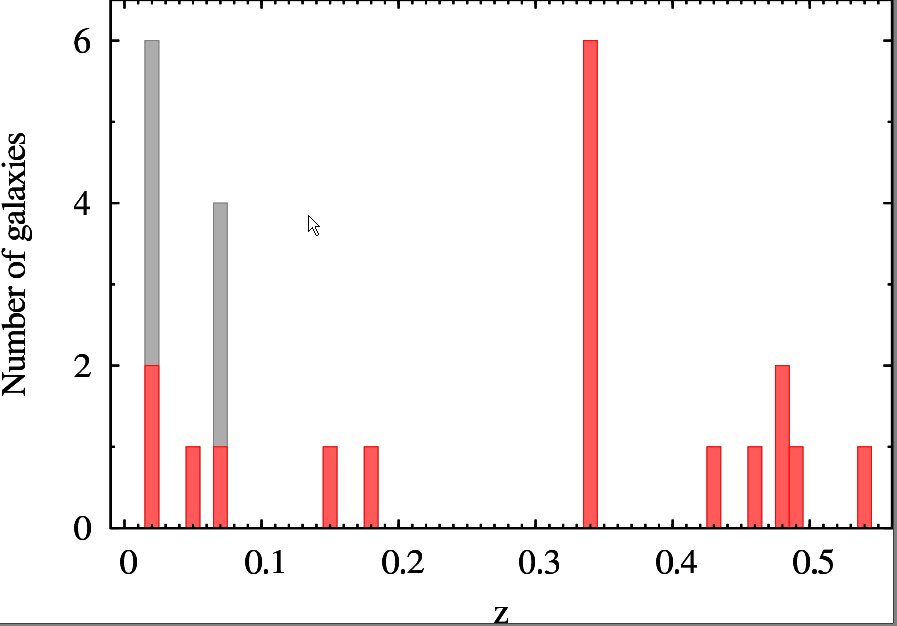 |
Figure 3 -
Redshift distribution of observed sources in a field of radius 7 arcmin centred on 3C 66A.
Each bar represents the total number of objects with spectroscopic redshifts, both within (red) and
outside (grey) the field studied in this paper. The histogram shows three galaxy groupings, at
z ~ 0.34, z ~ 0.067 and at z ~ 0.02 in the close (projected) environment of
the blazar.
|

|
Figure 4a-f -
Optical spectra (B600_G5307 grating) of the six sources identified as group members at z ~ 0.34
within the field of 3C 66A, in units of counts per Å (no flux calibration was applied).
Spectral features used to determine the redshifts of the sources are labelled. A few emissions
are residuals from poorly corrected sky lines.
|
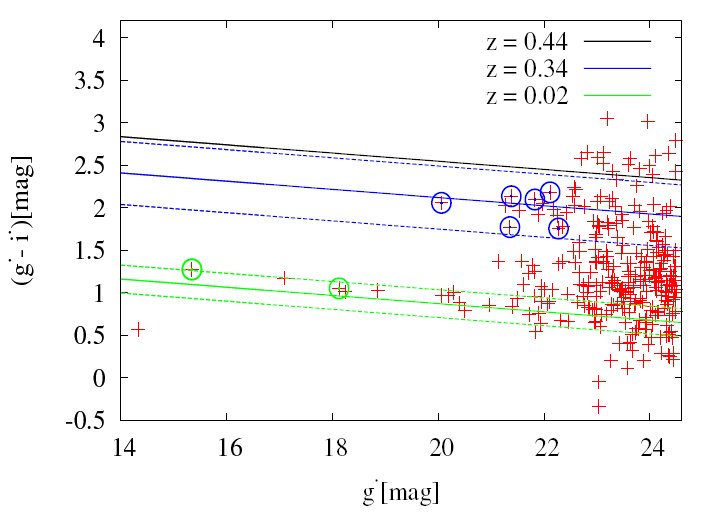 |
Figure 5 -
Colour-magnitude diagram (CMD) for detected galaxies in the
field of 3C 66A (red crosses). Framed crosses within blue circles indicate
the position of cluster members confirmed through spectroscopic redshifts
(z = 0.34±0.001). The blue solid line shows the Virgo cluster CRS shifted
to z = 0.34. Framed crosses within green circles indicate galaxies with
spectroscopic redshifts z ~ 0.02. The green solid line shows the Virgo cluster
CRS shifted to z = 0.02. Dashed lines show the adopted colour scatter
in each case. The black solid line shows the Virgo cluster CRS shifted to
z = 0.444.
|
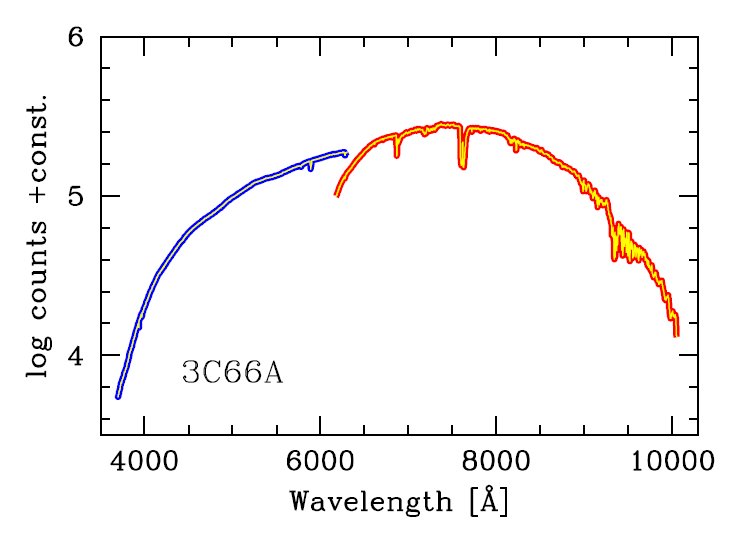 |
Figure 6 -
Wavelength branches of 3C 66As spectrum. The branch obtained
with the B600_G5307 grating (blue line) covers a spectral range between
3500 Å and 6500 Å, while the branch obtained with the R400_G5325 grating
(red line) covers a spectral range between 6100 Å and 10,000 Å.
|
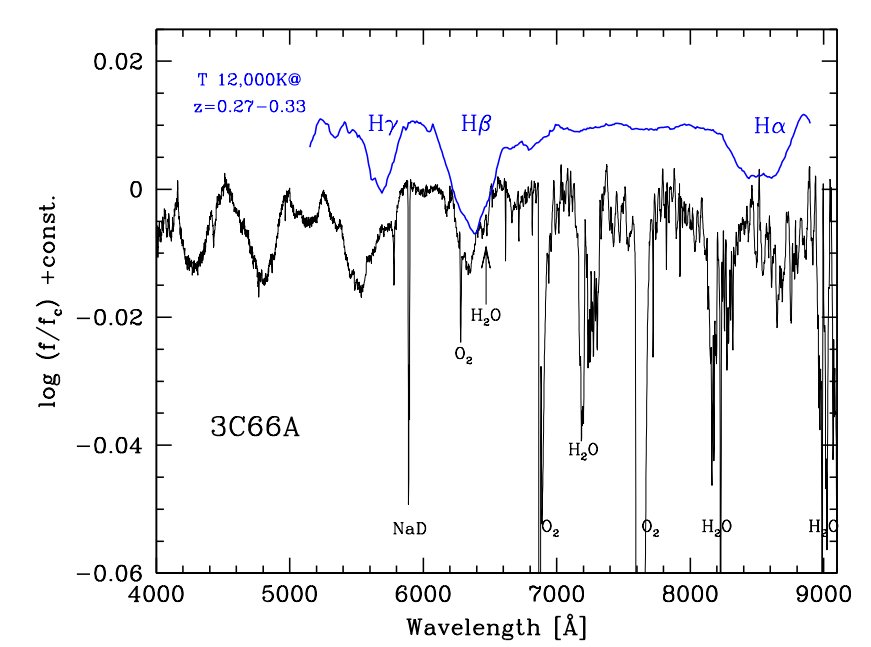 |
Figure 7 -
The linearised 3C 66A spectrum, compared with a Bluered synthetic spectrum of a stellar
model atmosphere with T = 12 000K shifted within the range 0.27 <z< 0.33 (blue line).
The Balmer sequence of the Hγ, Hβ and Hα absorption lines might be recognised to
match the blazar spectrum. See text for a discussion.
|
Back to article listing |
|
Shortcut to Space Stuff |
| AB/Oct 2017 |
|
|