Back to article listing

Shortcut to Space Stuff
Shortcut to SSP & Galaxy Template models
Shortcut to UVBLUE & BLUERED libraries


Vellutini, E., Bianchi, G., Pardini, C., Anselmo, L., Pisanu, T., Di Lizia, P., Piergentili, F., Monaci, F., Reali, M., Villadei, W., Buzzoni, A., D’Amore, G. & Perozzi, E.:
"Monitoring the final orbital decay and the re-entry of Tiangong-1 with the Italian SST ground sensor network"
2020, Journal of Space Safety Engineering, 7, 487


Summary:
The uncontrolled re-entry of spacecraft and upper stages is quite common, occurring nearly every week. Among them, intact objects having a mass greater than five metric tons re-enter, on average, 1–2 times per year. Therefore, the re-entry of the first Chinese Space Station, Tiangong-1, was far from unusual, but attracted anyway a great worldwide attention and some concerns. For these reasons, the Italian component of the European SST (Space Surveillance and Tracking) consortium took this opportunity for carrying out a national exercise. According to Chinese official sources, the ground control of Tiangong-1 was lost in March 2016, precluding the planned de-orbiting in the South Pacific Ocean Unpopulated Area (SPOUA). Tiangong-1 consisted of a cylindrical section, 10:5 m in length and 3:4 m in (maximum) diameter, with two rectangular solar panels of 3×7 m. The mass was estimated to be around 7500 kg. The Italian network of sensors activated for the campaign included mono-static and bi-static radars, optical telescopes, a laser ranging station and a network of all-sky cameras, originally deployed for the observation of fireballs and bolides. In addition to providing complementary information, concerning the orbit, the attitude and the photometry of Tiangong-1, this quite heterogeneous collection of national assets provided also the occasion for testing, in an operational environment, the Italian sensor tasking preparedness and the data acquisition, exchange and processing capabilities within the European SST consortium. In this respect, it is important to remember that in 2014 the European Commission, well aware of the topic criticality, took the commitment to implement a European network of sensors for surveillance and tracking of objects in Earth’s orbit by starting a dedicated SST support framework program. Italy, France, Germany, Spain and UK joined it and constituted, together with SatCent, the front desk for SST services, the EUSST Consortium. In this paper, a description of the Tiangong-1 monitoring activities and of the main observations results obtained by the Italian sensor network are reported. Attention is also devoted to the coordination aspects of several Italian entities (military, civil and research organizations) that worked together. Finally, a description of the re-entry prediction and alert procedure for the national civil protection authorities is presented.

Enhanced HTML/PDF version at the JSSE site  (*)
(*) May require access password
Local link to the PDF version (800 Kb)
(For personal use only)
   Browse figures in hires (click on the thumbnails)
Figure 1 -
SPADE telescope.
Figure 2 -
Northern Cross.
Figure 3 -
Sardinia Radio Telescope.
Figure 4 -
PdM-MiTe telescope.
Figure 5 -
MFDR.
Figure 6 -
Overall Organizational Scheme.
Figure 7 -
ISOC Operational Regimes for RE Service.
Figure 8 -
Resdual ratio example.
Figure 9 -
Range trend between ISOC OD and TLEs.
Figure 10 -
SNR profiles measured by BIRALES.
Figure 11 -
DS profile measured by BIRALES.
Figure 12 -
Comparison between the estimated angular path and the one predicted from the TLE.
Figure 13 -
Comparison between the ground tracks of the determined orbit (blue line) and the TLE-based prediction (red line).
Figure 14 -
Intersection between the line connecting the ground station to the ob- served object position and the orbital plane.
Figure 15 -
Result of the rendering engine on the 3D model of the Tiangong-1. In the image are also depicted the shadow areas cast by the object on itself.
Figure 16 -
In red the synthetic lightcurve found by the algorithm. In blue the real lightcurve of the Tiangong-1 passing over Rome the 15/02/2018.
Figure 17 -
Evolution of the semi-major axis of Tiangong-1 since the launch, on 29 September 2011, in which the effects of the main manoeuvres are highlighted.
Figure 18 -
Daily and 81-day averaged solar flux at 10.7 cm during the re-entry campaign.
Figure 19 -
Distribution of the re-entry predictions from 1 February to 15 March 2018.
Figure 20 -
Distribution of the re-entry predictions carried out on 19 and 20 March 2018.
Figure 21 -
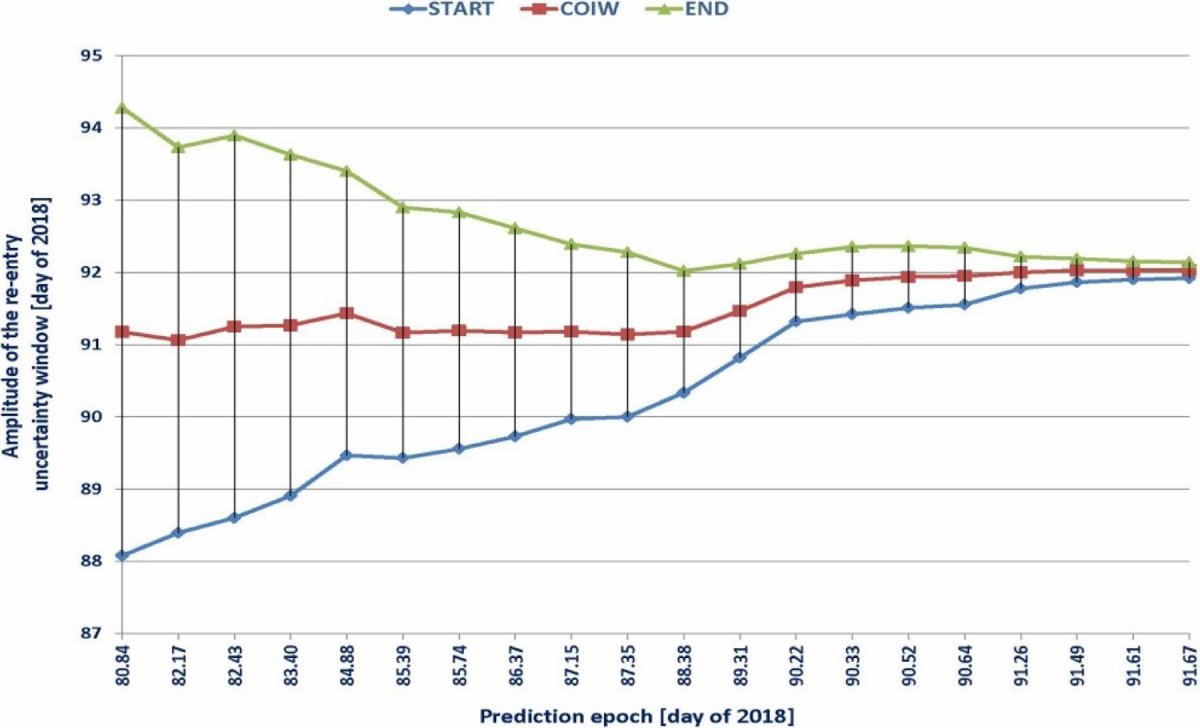
Uncertainty windows associated with the re-entry predictions carried out since 21 March 2018.
Figure 22 -
Sub-satellite ground tracks corre- sponding to the uncertainty window computed about 9 h before re-entry.
Figure 23 -
Tiangong-1 Re-entry Epoch ISOC Prediction Evolution.
Figure 24 -
Tiangong-1 Apogee/Perigee ISOC Computation Evolution.


Back to article listing

Shortcut to Space Stuff
Shortcut to SSP & Galaxy Template models
Shortcut to UVBLUE & BLUERED libraries


AB/May 2021