Back to article listing

Back to article listing |
|
Shortcut to Space Stuff |
| Carbognani, A., Barghini, D., Gardiol, D., Di Martino, M., Valsecchi, G. B., Trivero, P., Buzzoni, A., Rasetti, S., Selvestrel, D., Knapic, C., Londero, E., Zorba, S., Volpicelli, C. A., Di Carlo, M., Vaubaillon, J., Marmo, C., Colas, F., Valeri, D., Zanotti, F., Morini, M., Demaria, P., Zanda, B., Bouley, S., Vernazza, P., Gattacceca, J., Rault, J. L., Maquet, L., Birlan, M.: |
| "A case study of the May 30, 2017, Italian fireball" 2020, The European Physical Journal Plus, 135, id.255 |
|
|
Summary:
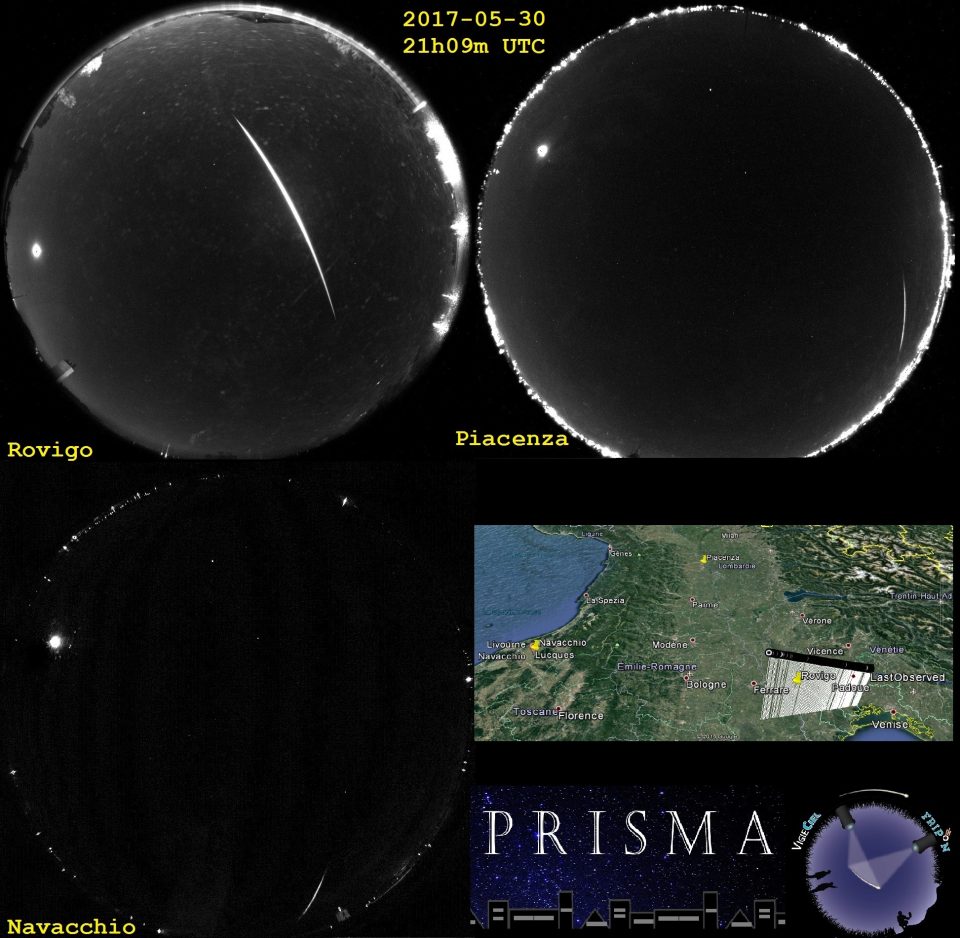
On May 30, 2017, at about 21 h 09 min 17 s UTC a green bright fireball crossed the sky
of north-eastern Italy.
The fireball path was observed from some all-sky cameras starting from a mean altitude of 81.1±0.2 km
(Lat. 44.369o±0.002o N; Long. 11.859o±0.002o E) and extinct at
23.3±0.2 km (Lat. 45.246o±0.002o N; Long. 12.046o±0.002o E),
between the Italian cities of Venice and Padua. In this paper, on the basis of simple physical models, we
will compute the atmospheric trajectory, analyze the meteoroid atmospheric dynamics, the dark flight phase
(with the strewn field) and compute the best heliocentric orbit of the progenitor body. Search for meteorites
on the ground has not produced any results so far.
|
|
Enhanced HTML/PDF version at the EPJ Plus site (*) (*) May require access password |
Local link to the PDF version (600 Kb)
(For personal use only) | ||
| Pick up the paper at Astro-ph/1911.09555 |
|
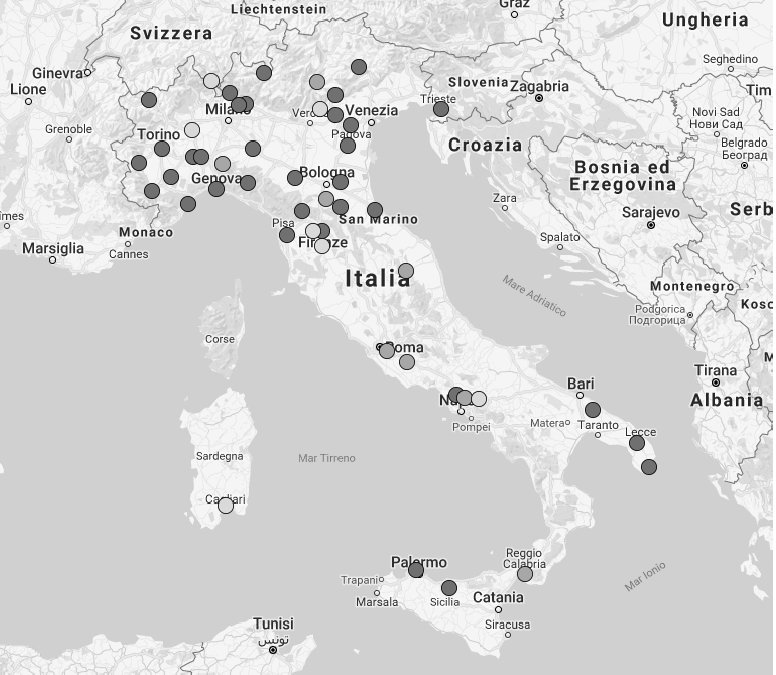
Figure 1 -
A map from Google Earth showing the distribution of PRISMA stations on April 2019. Most of the stations are concentrated in northern
Italy. Legend: dark dots = working camera; gray/white dots = setup phase.
|
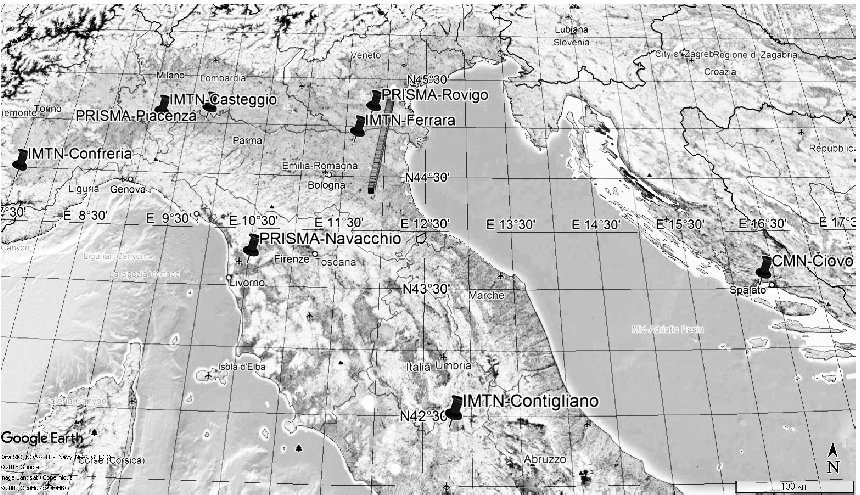
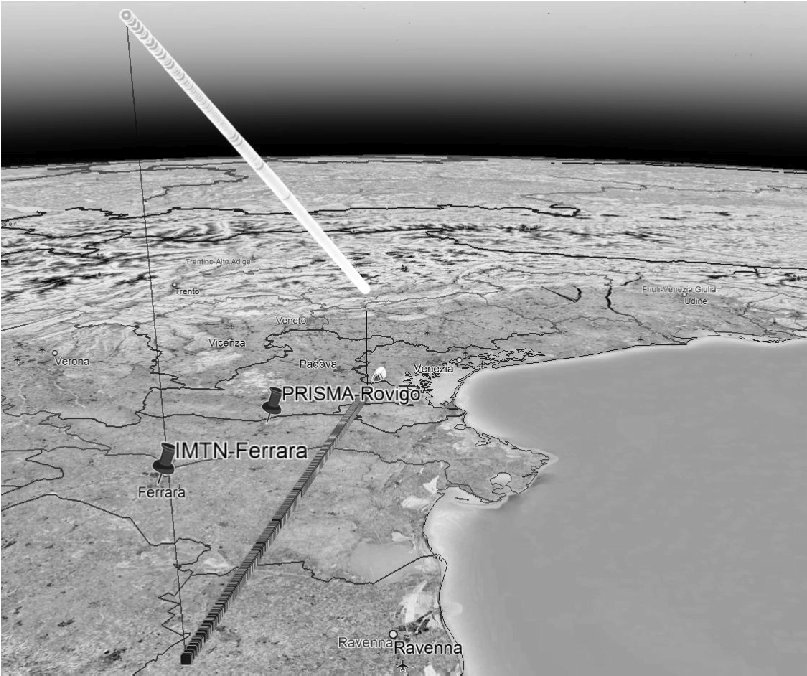
| Figure 2 -
A Google Earth map showing the position of the stations listed in Table 1 and the fireball trajectory projected on the ground.
|
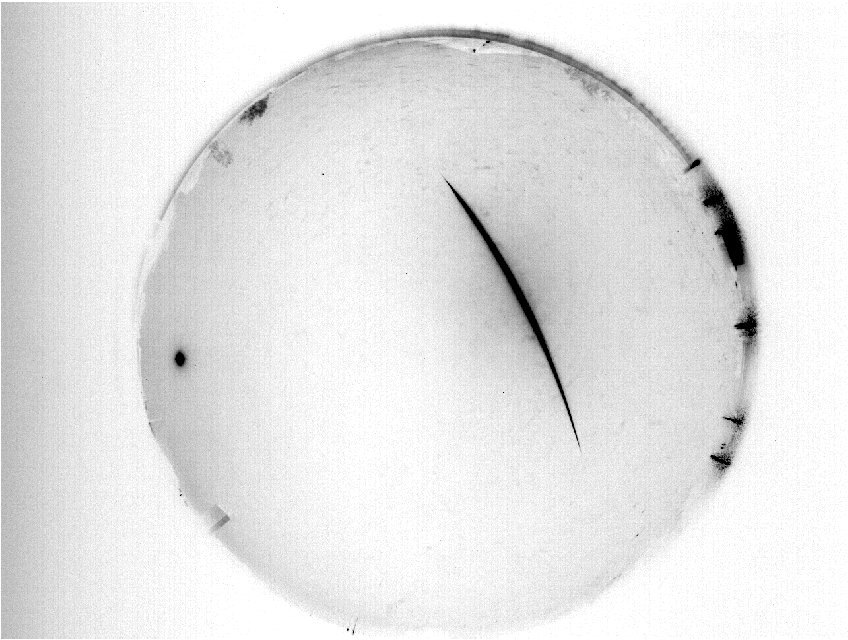 |
Figure 3 -
A negative image showing the full path of IT20170530 from Rovigo. North is down, South is up.
The bright object on the left is the Moon near the western horizon. The fireball moved from top left to bottom right.
The total duration of the fireball was about 9.51 s. From this image, no significant fragmentation of the meteoroid appears.
|
|
Figure 4 -
A Google Earth map showing the best trajectories, both in atmosphere and projected on the ground, resulting from the triangulation
between PRISMA-Rovigo, IMTN-Casteggio and IMTN-Contigliano.
|
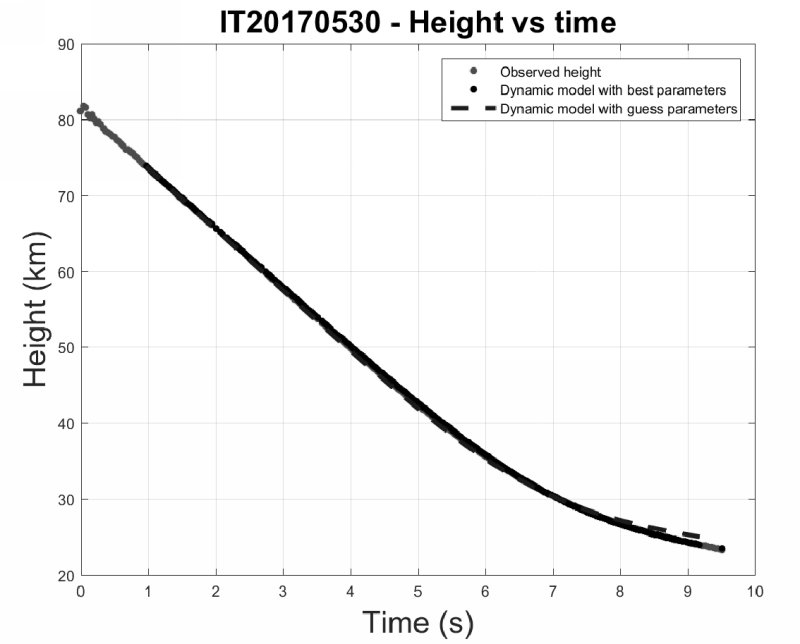 |
Figure 5 -
Fireball height versus time as a result of the triangulation from Rovigo, Contigliano and Casteggio. Gray dots = observed values;
dotted line = model with starting guess values; black line = best fit model.
|
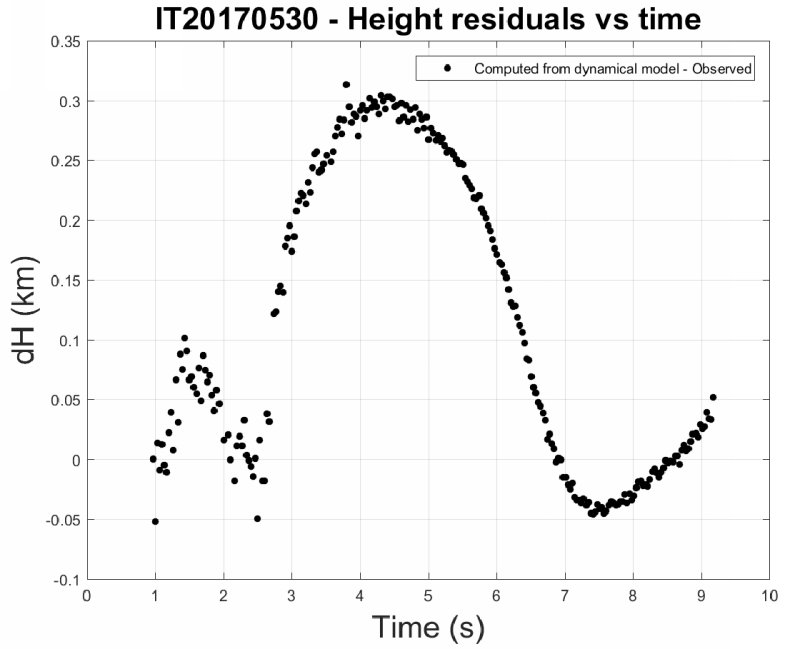 |
Figure 6 -
Residual between the observed height versus time values and the dynamical model of the meteoroid (Rovigo, Contigliano and Casteggio).
The mean residual value is about 0.12 km, discussion in the text.
|
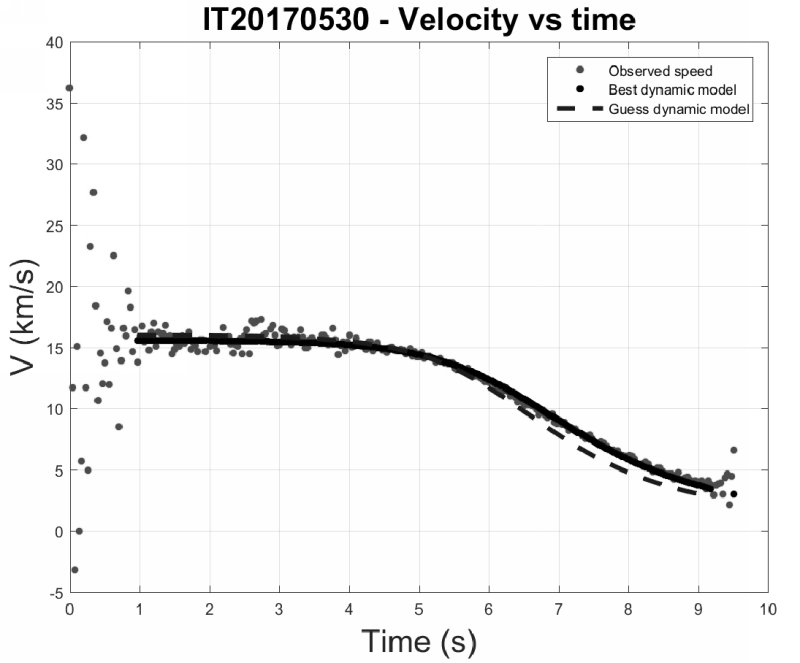 |
Figure 7 -
Fireball velocity versus time as a result of the triangulation from Rovigo, Contigliano and Casteggio.
The speed is computed using Rovigos temporal data only. The initial dispersion of the points is due to the fact that
the fireball was very far from the station and the displacement was low. In this condition, the sky position uncertainty
is the dominant factor in the computed velocity. Gray dots = observed values; dotted black line = model with starting guess
values; black line = best fit model.
|
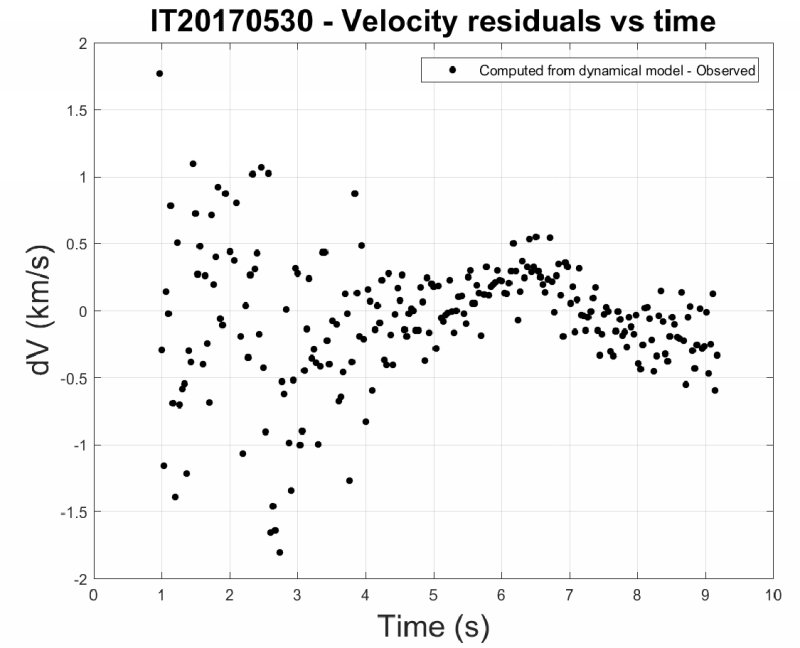 |
Figure 8 -
Residual between the observed velocity values versus time and the dynamical model of the meteoroid (Rovigo with Contigliano and
Casteggio). The mean residual value is about 0.3 km/s, discussion in the text.
|
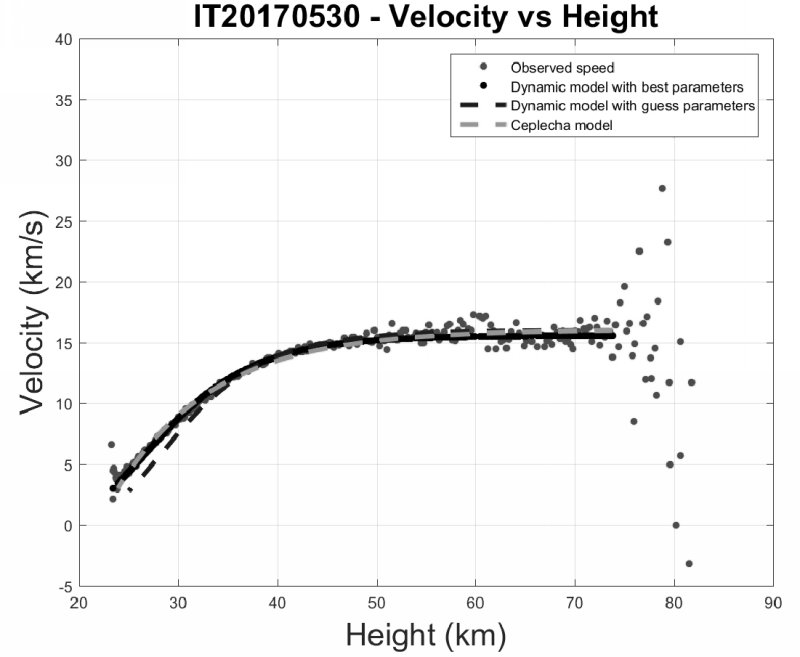 |
Figure 9 -
Fireball velocity versus height as a result of the triangulation from Rovigo with Contigliano and Casteggio.
Gray dots = observed values; dotted black line = model with starting guess values; black line = best fit model.
|
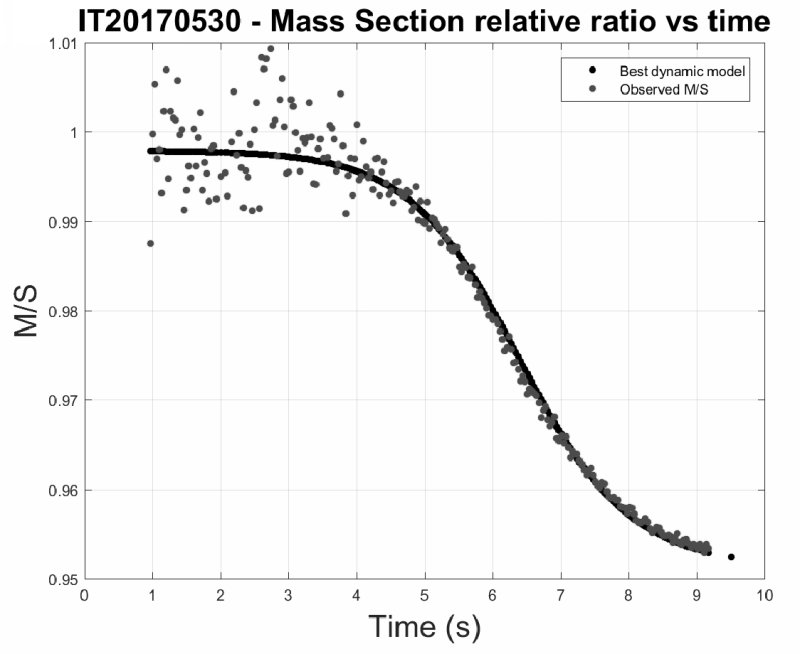 |
Figure 10 -
Fireball relative mass/(cross section) ratio versus time as a result of the triangulation from Rovigo with Contigliano and
Casteggio. In this figure, it is possible to follow the meteoroid ablation versus time because M/S ∝ r, where r is the meteoroid
radius. The best fit model line starts below 1 because the first observation was made when the ablation was already on.
The scattering is due to the initial uncertainty on the fireball speed. Gray dots = observed values; black line = best fit model.
|
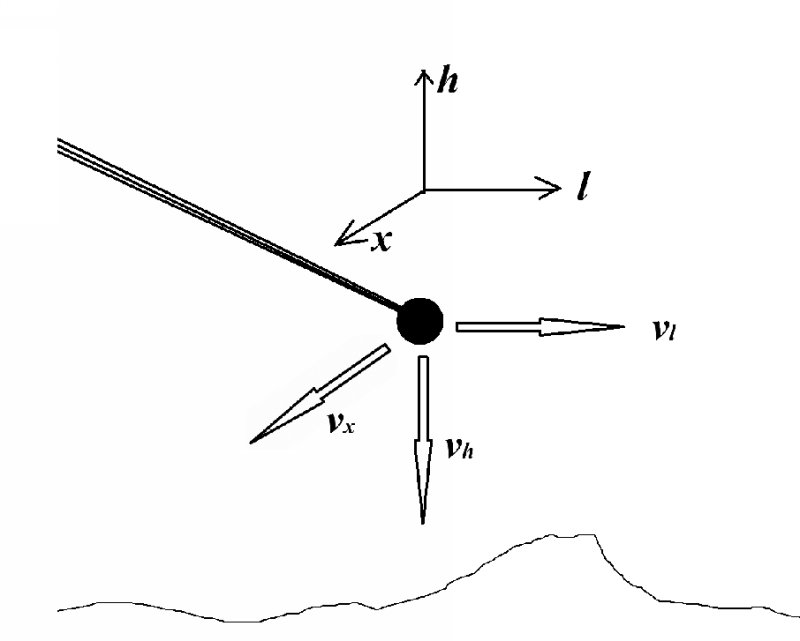 |
Figure 11 -
Fireball reference system (l, h, x) for dark flight phase. The black dot is the terminal point of the luminous path.
The component velocity vl is parallel to the fireball motion direction, vx is along the orthogonal direction, and vh is
toward the bottom (so vh<0 always).
|
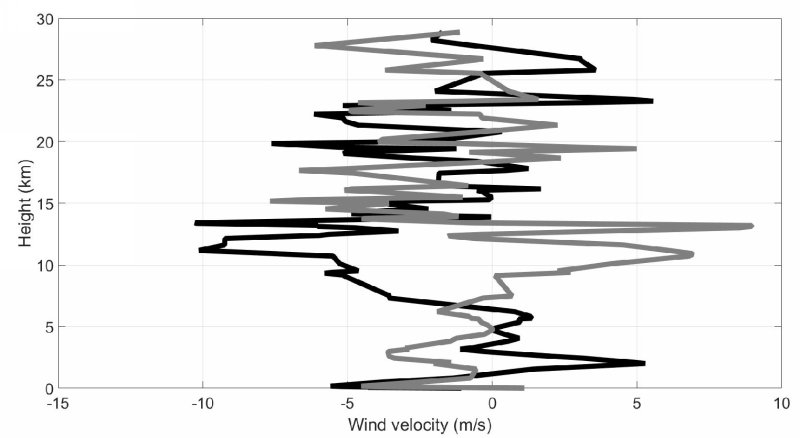 |
Figure 12 -
Wind speed versus height in the meteoroid reference system from San Pietro Capofiume.
Black line: wind along meteoroid motion direction (l axis). Wind speed values greater than zero are against
meteoroid motion. Gray line: right orthogonal direction to the meteoroid motion (lx axis).
Wind speed values greater than zero are against the positive direction of vx.
|
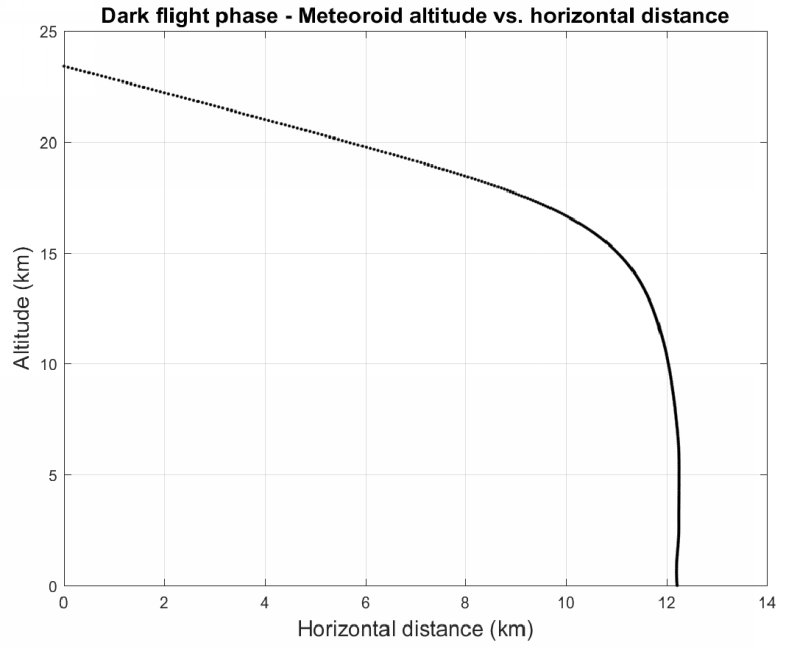 |
Figure 13 -
Parallel view of the residual meteoroid height versus horizontal distance along the l axis starting from the terminal point.
Notice the small deformations at the end of the vertical section of the trajectory, due to the wind.
|
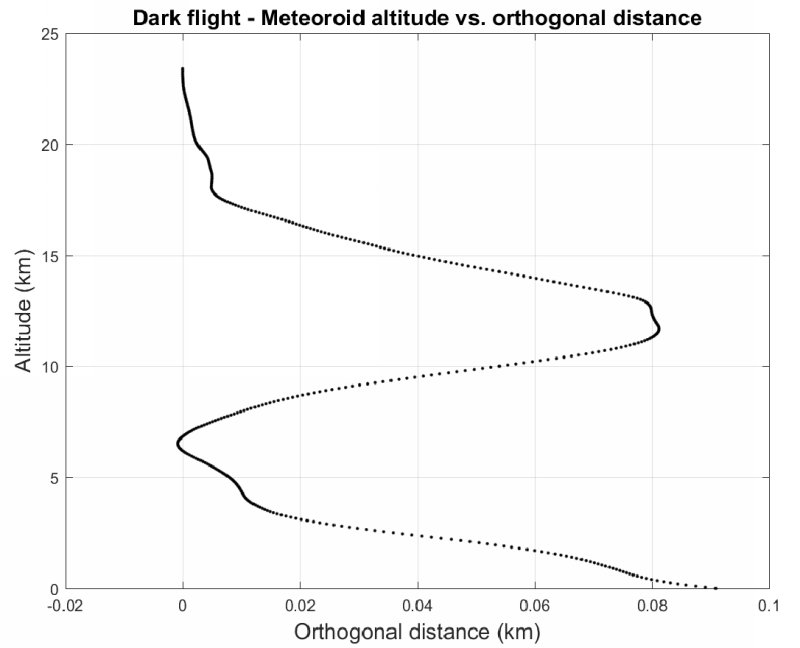 |
Figure 14 -
Front view of the residual meteoroid trajectory. Meteoroid height versus orthogonal distance lx. The trajectory oscillations are
in phase with the winds directions, but the orthogonal movements are a few tens of meters only.
|
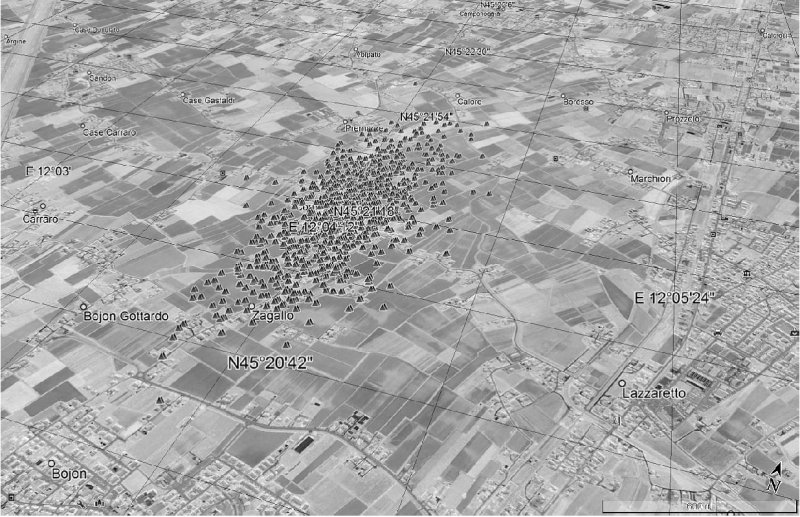 |
Figure 15 -
A Google Earth maps showing the possible impact points on the ground obtained from the Monte Carlo simulation.
The strewn field dimension is about 1.7 × 0.6 km, about north of the town of Bojon.
|
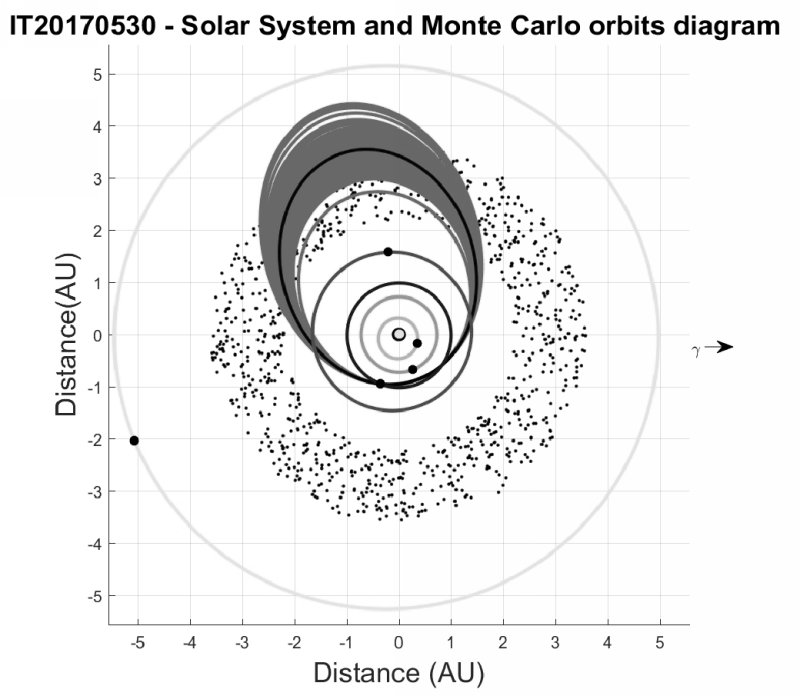 |
Figure 16 -
Nominal heliocentric orbit for the progenitor meteoroid of the fireball IT20170530 as seen from the ecliptic north pole.
The dots symbolically represent the Main Belt.
The position of the planets on their orbits is that at the time of the fireball.
The fireball clones orbit are indicated in gray color.
|
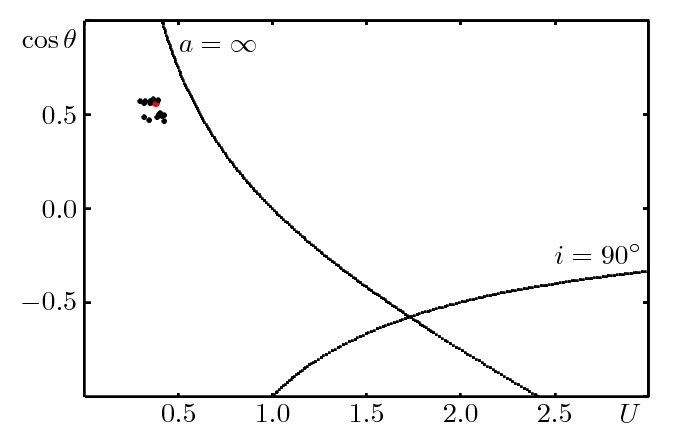 |
Figure 17 -
Black dots show the NEAs with DN < 0.15 in the plane U-cosθ; the big red dot shows IT20170530.
The region below the a = 8 line contains orbits bound to the Sun, and the region on the left of
the i = 90o line contains prograde orbits.
|
Back to article listing |
|
Shortcut to Space Stuff |
| AB/May 2021 |
|
|