Back to article listing

Back to article listing |
|
Shortcut to Space Stuff |
| Daquin, J., Alessi, E. M., O'Leary, J., Lemaitre, A., Buzzoni, A.: |
| "Dynamical properties of the Molniya satellite constellation: long-term evolution
of the semi-major axis" 2021, Nonlinear Dynamics, 105, 2081 |
|
|
Summary:
We describe the phase space structures related to the semi-major axis of Molniya-like satellites subject to
tesseral and lunisolar resonances. In particular, the questions answered in this contribution are: (1) we
study the indirect interplay of the critical inclination resonance on the semi-geosynchronous resonance using
a hierarchy of more realistic dynamical systems, thus discussing the dynamics beyond the integrable approximation.
By introducing ad hoc tractable models averaged over fast angles, (2) we numerically demarcate the hyperbolic
structures organising the long-term dynamics via fast Lyapunov indicators cartography. Based on the publicly
available two-line elements space orbital data, (3) we identify two satellites, namely Molniya 1-69 and Molniya 1-87,
displaying fingerprints consistent with the dynamics associated to the hyperbolic set. Finally, (4) the computations
of their associated dynamical maps highlight that the spacecraft are trapped within the hyperbolic tangle.
This research therefore reports evidence of actual artificial satellites in the near-Earth environment whose
dynamics are ruled by hyperbolic manifolds and resonant mechanisms. The tools, formalism and methodologies
we present are exportable to other region of space subject to similar commensurabilities as the geosynchronous region.
|
|
Enhanced HTML/PDF version at the Journal site (*) (*) May require access password |
Local link to the ArXiv PDF version (3.6 Mb) (also available at the ArXiv source site) (For personal use only) |
|
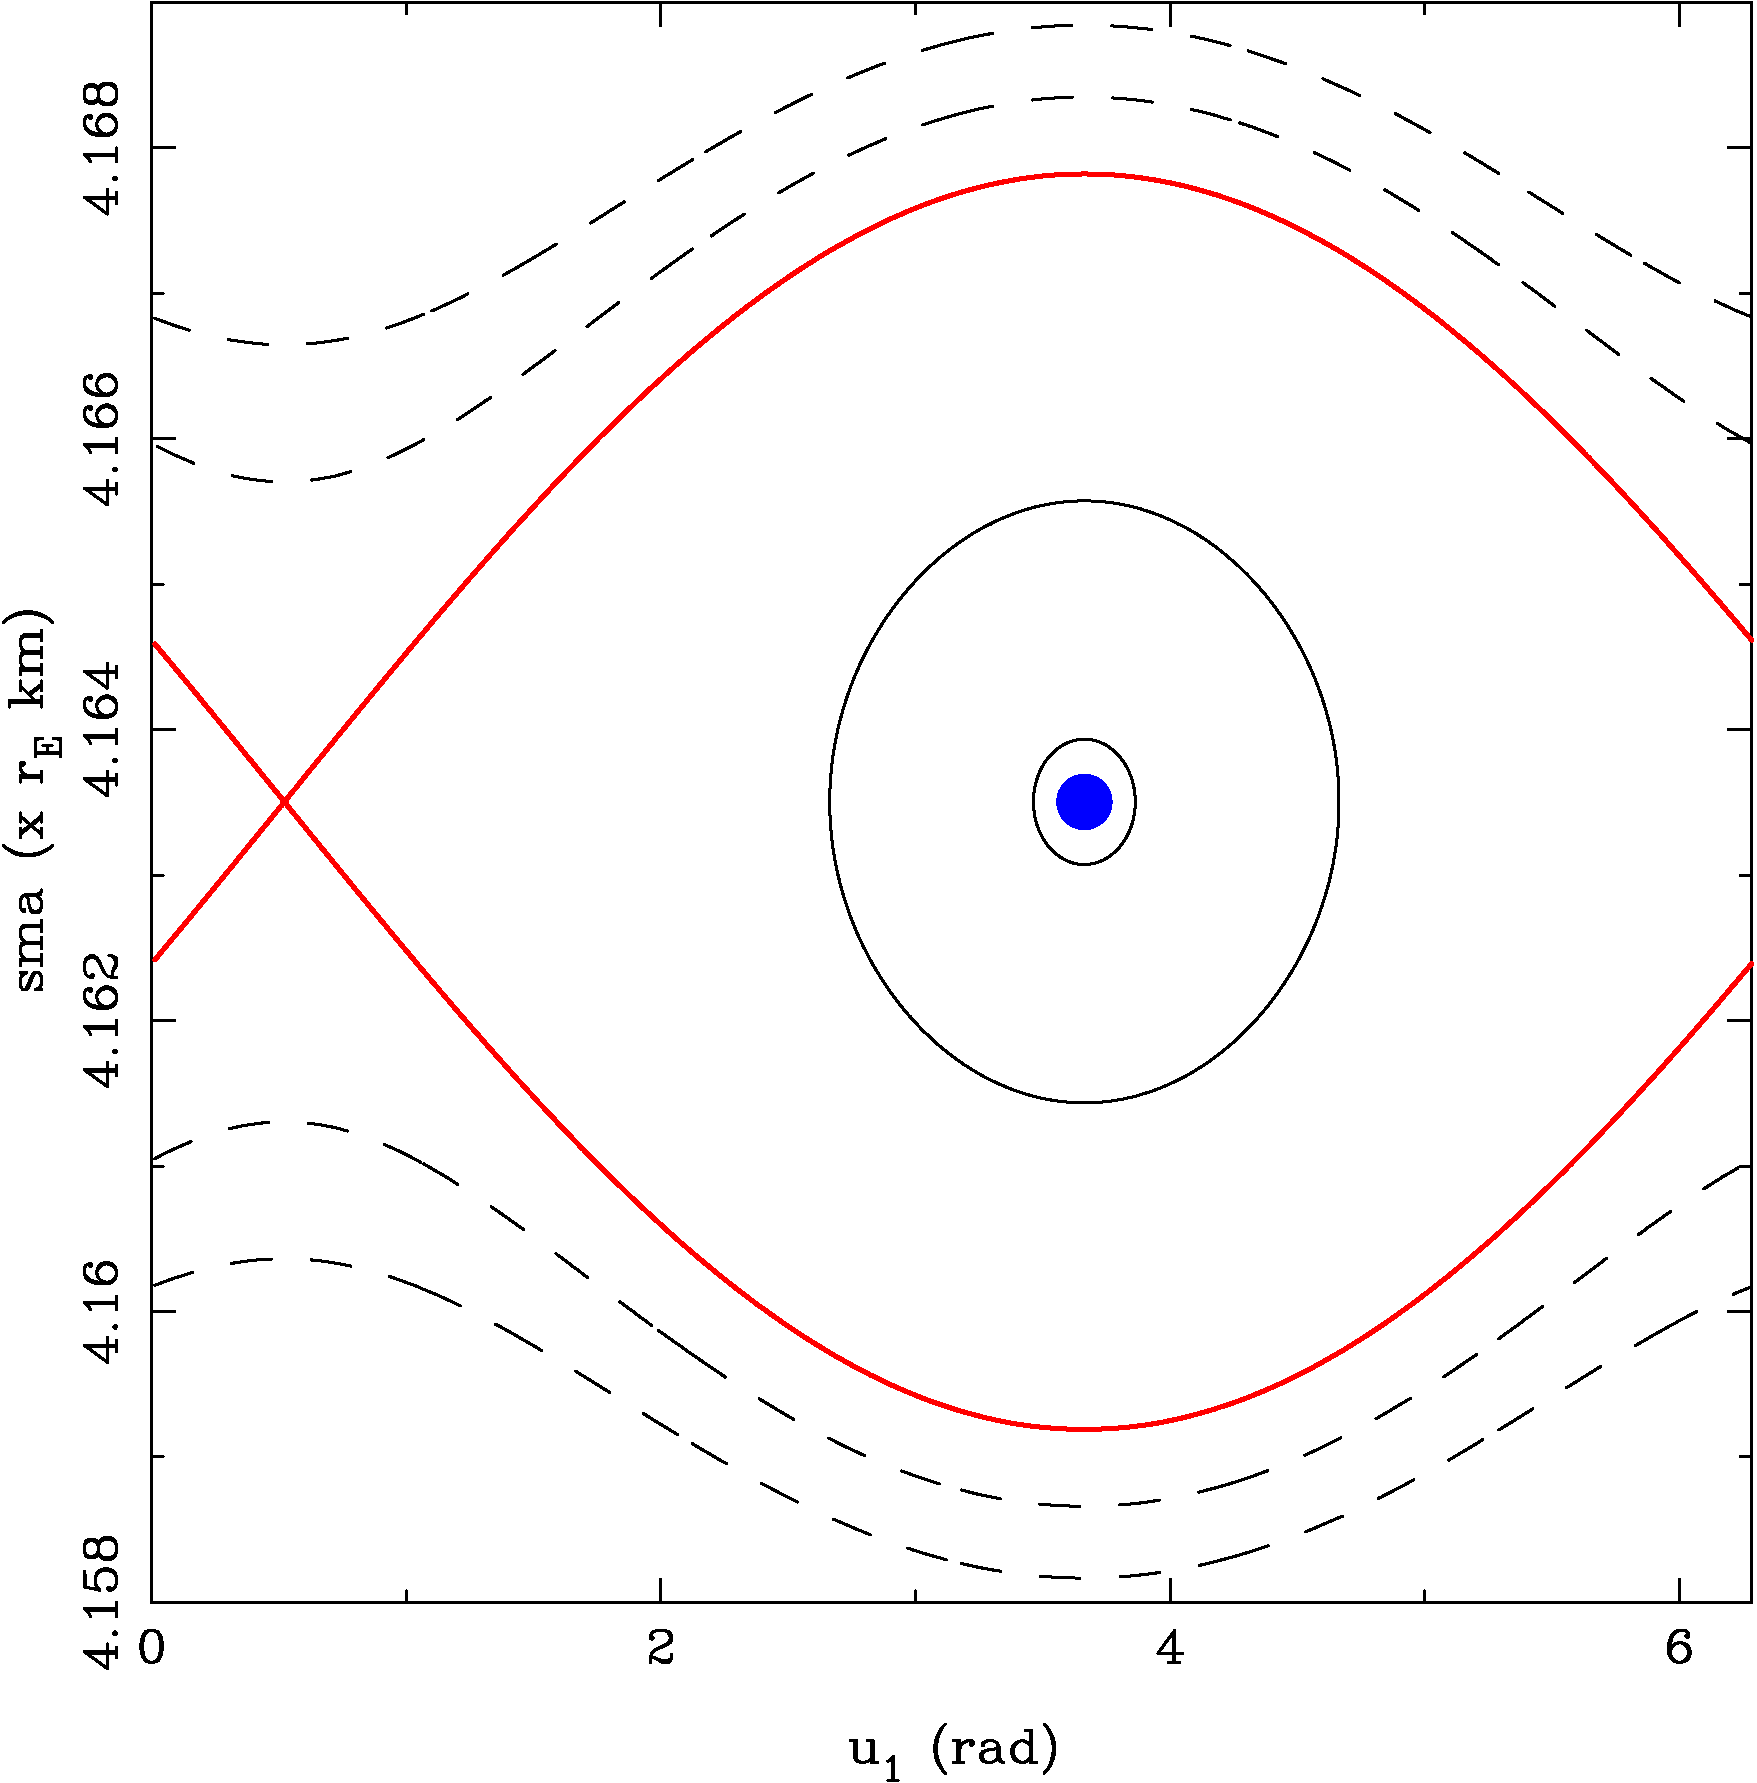
Figure 1 -
Phase space of the resonant integrable approximation. The width of the
separatrix (red curve) allows excursion of the semi-major axis up to 2Δa = 54 km
within the libration domain. The oscillations near the elliptic fixed-point (blue point)
have a period of about 1.76 years.
|
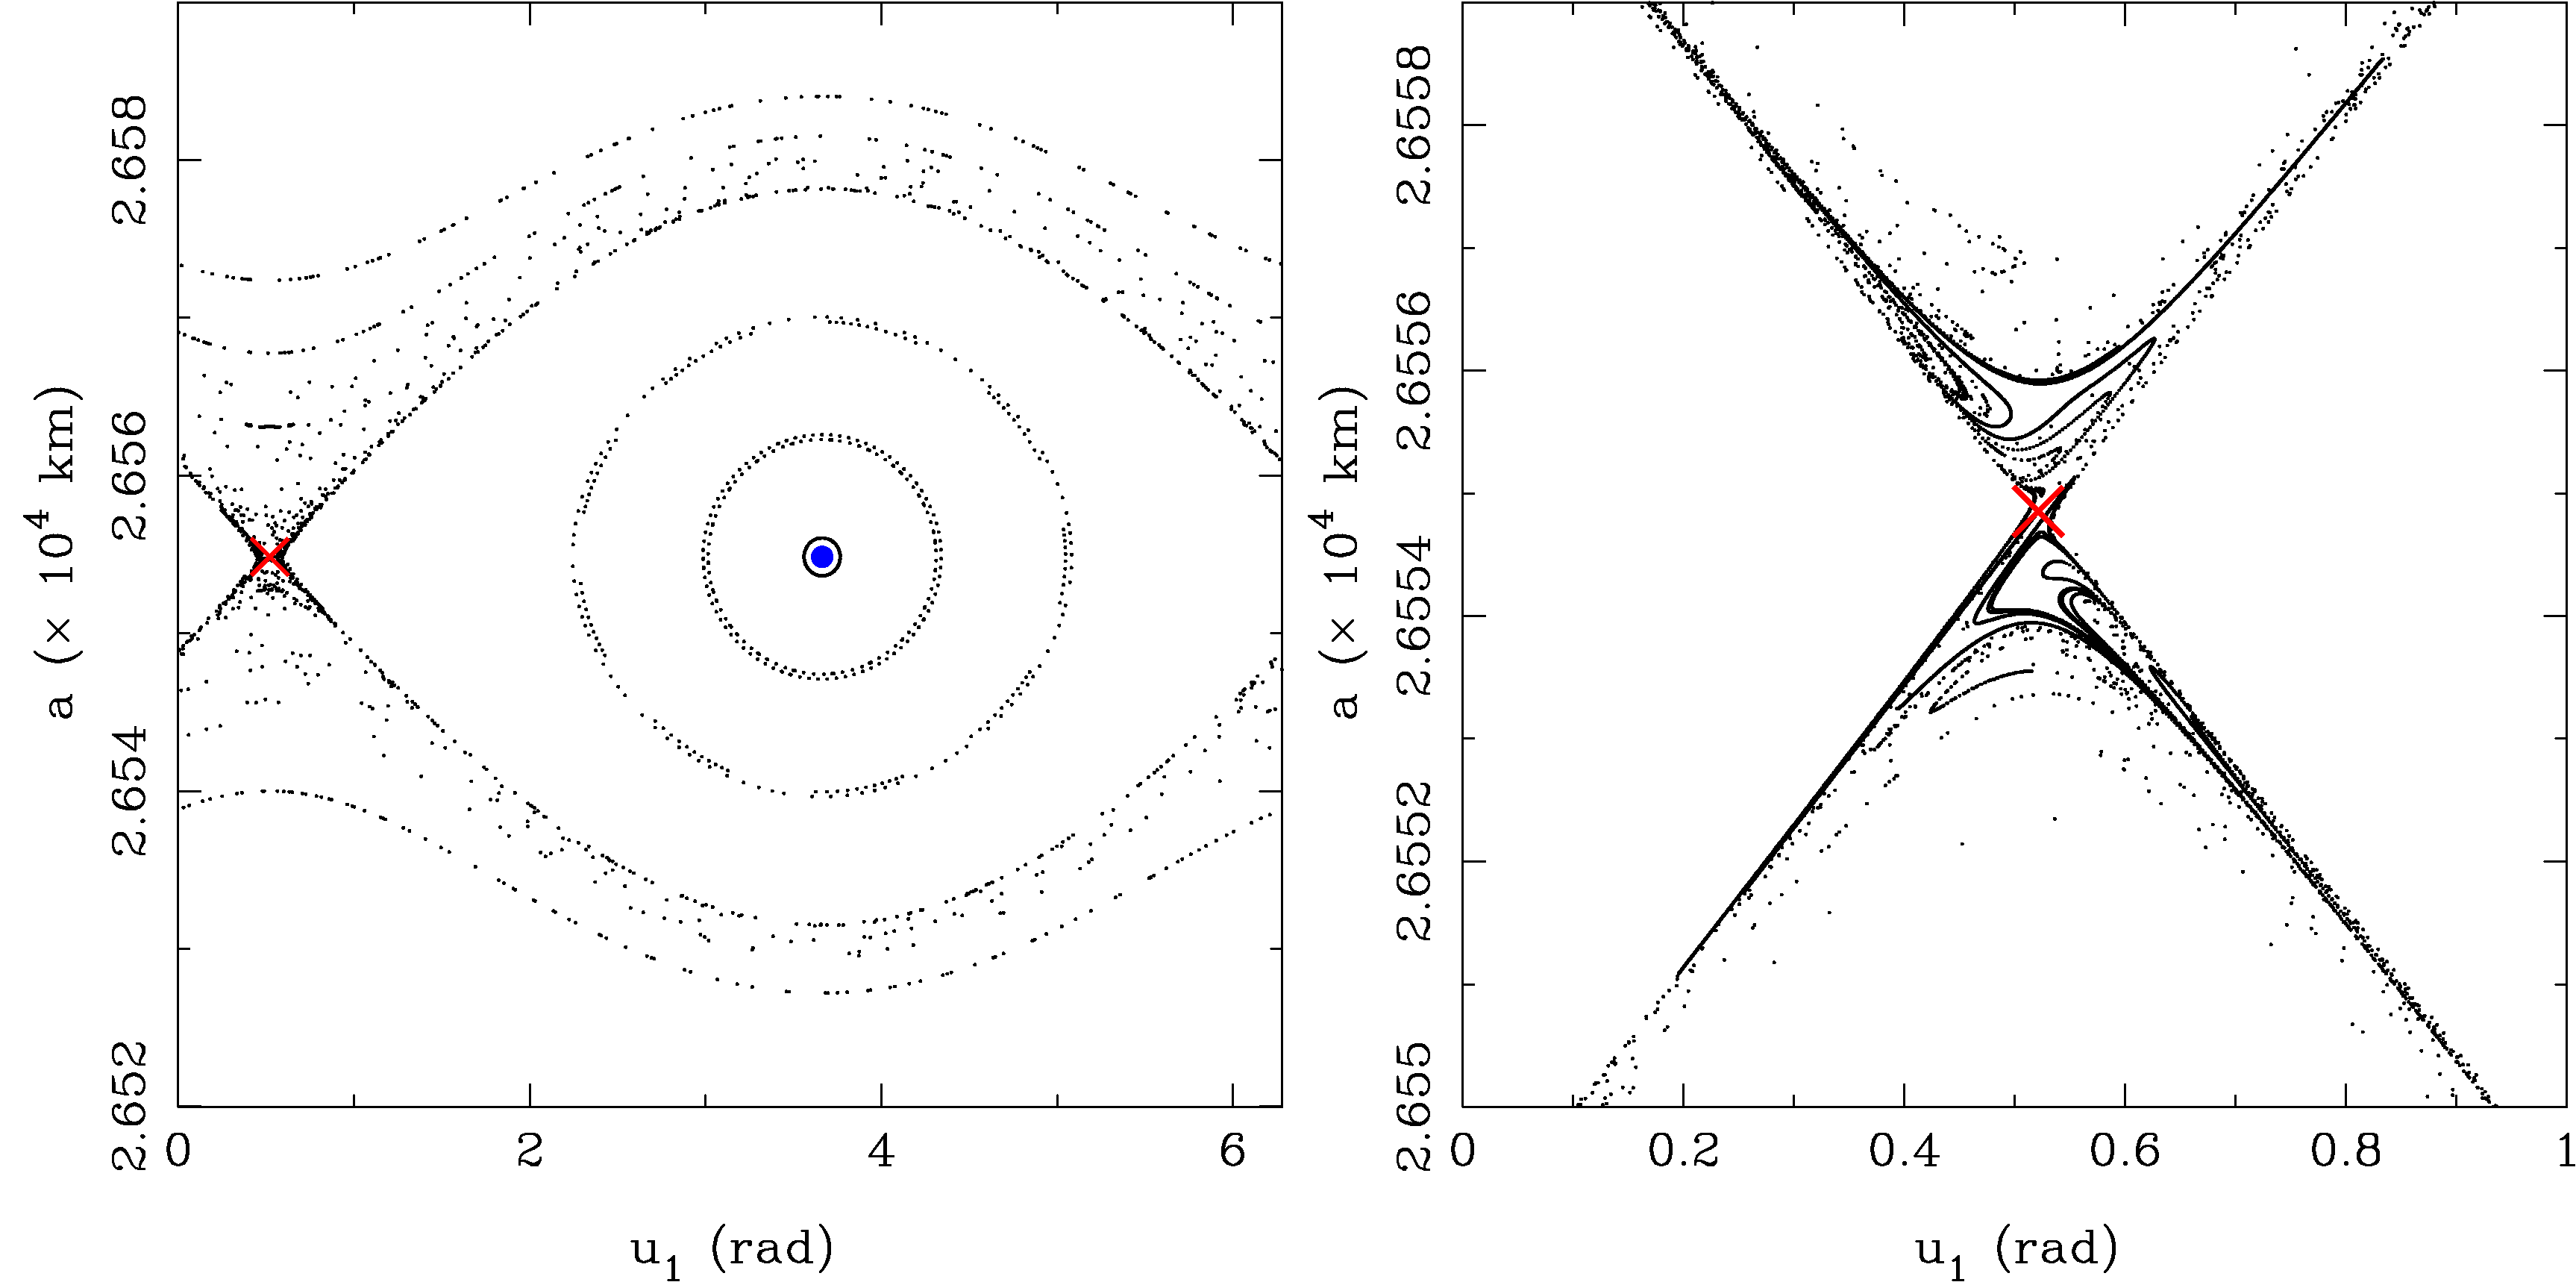
| Figure 2 -
(Left) Poincare' section associated to (35) computed for g(0) = 0. The unstable fixed point
is labeled with the red cross, the blue circle surrounds the stable periodic orbit. The phase
space is similar to the integrable approximation but contains a thin chaotic layer (scattered
erratic points) surrounding the unperturbed
separatrix. Each considered initial condition has been iterated 100 times under P.
(Right) Details of finite pieces of the stable manifold Ws(xu).
|
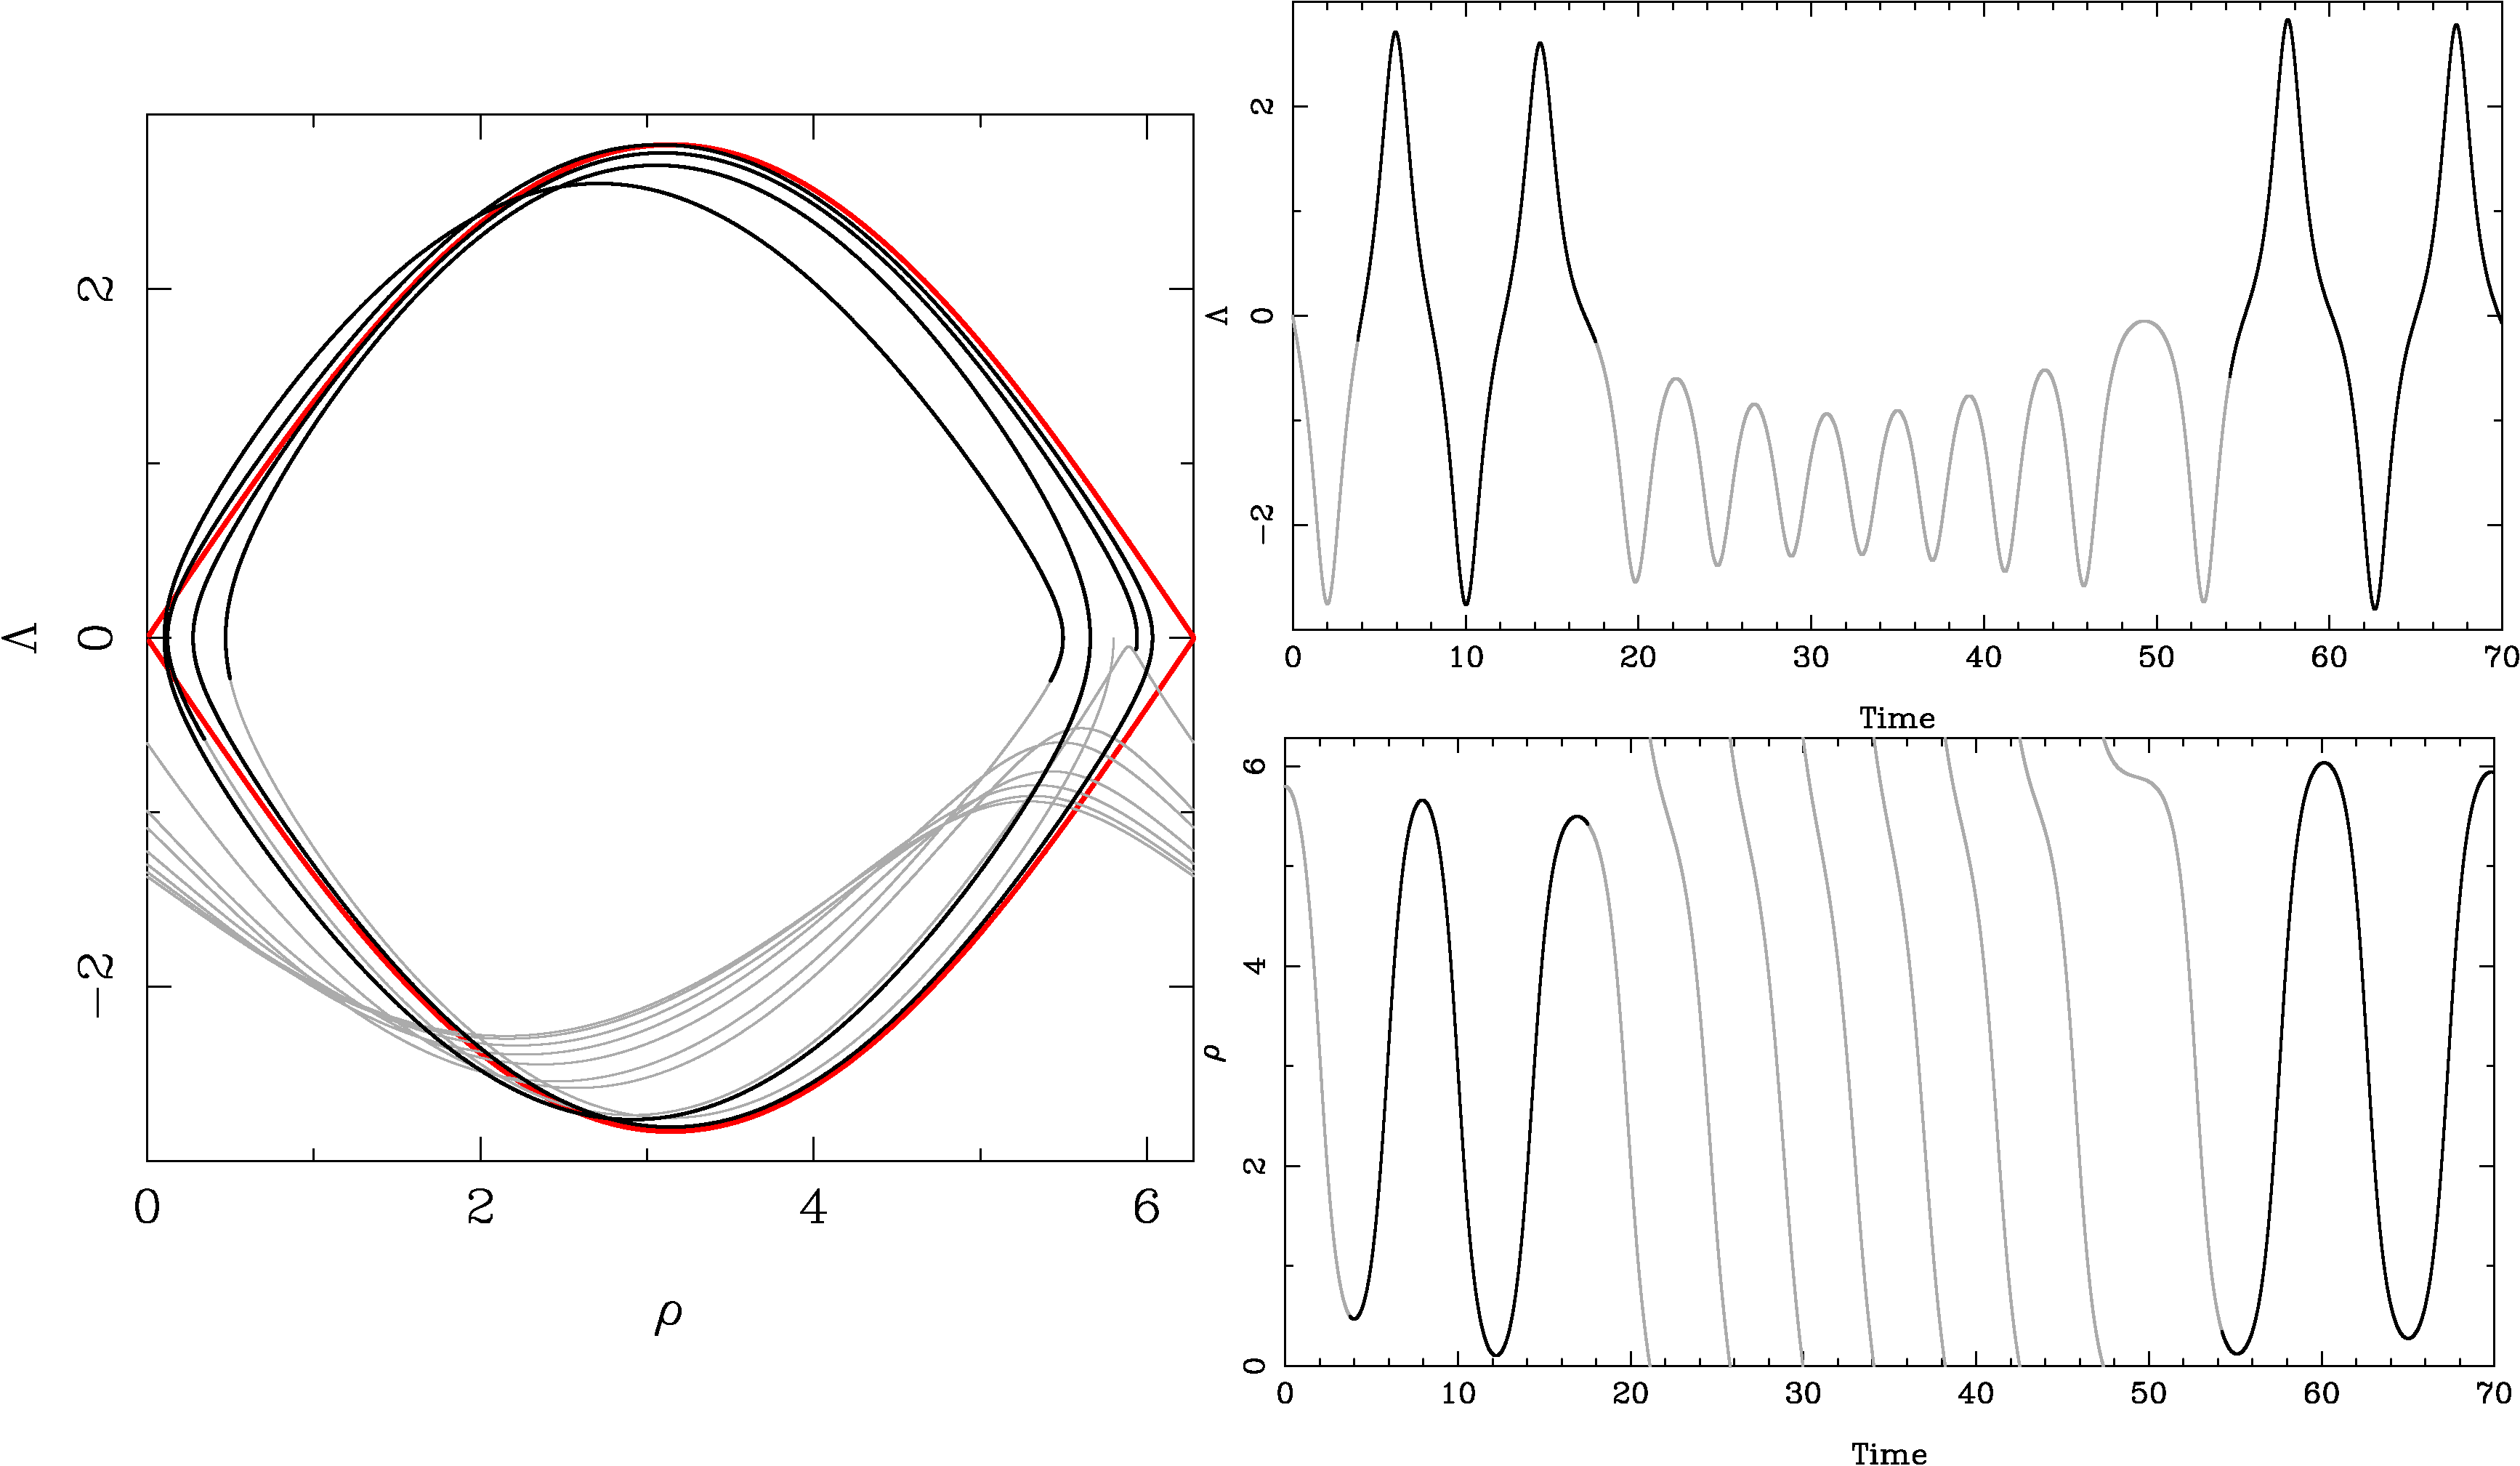 |
Figure 3 -
Composite plot illustrating the mechanisms of the intermittency phenomena. The red line represents the
separatrix of the integrable model T. Realisations
of the stable and unstable manifolds, for ε ≠ 0; ε << 1, are not shown for the sake
of readability. One hyperbolic orbit trapped in the hyperbolic tangle is highlighted
in the phase space, with a color code depending on the regime of the resonant angle.
When the resonant angle circulates (grey color), the action takes negative Λs. When
the angle librates (black color), the action variable performs the full homoclinic loop
and exhibit larger variations.
|
|
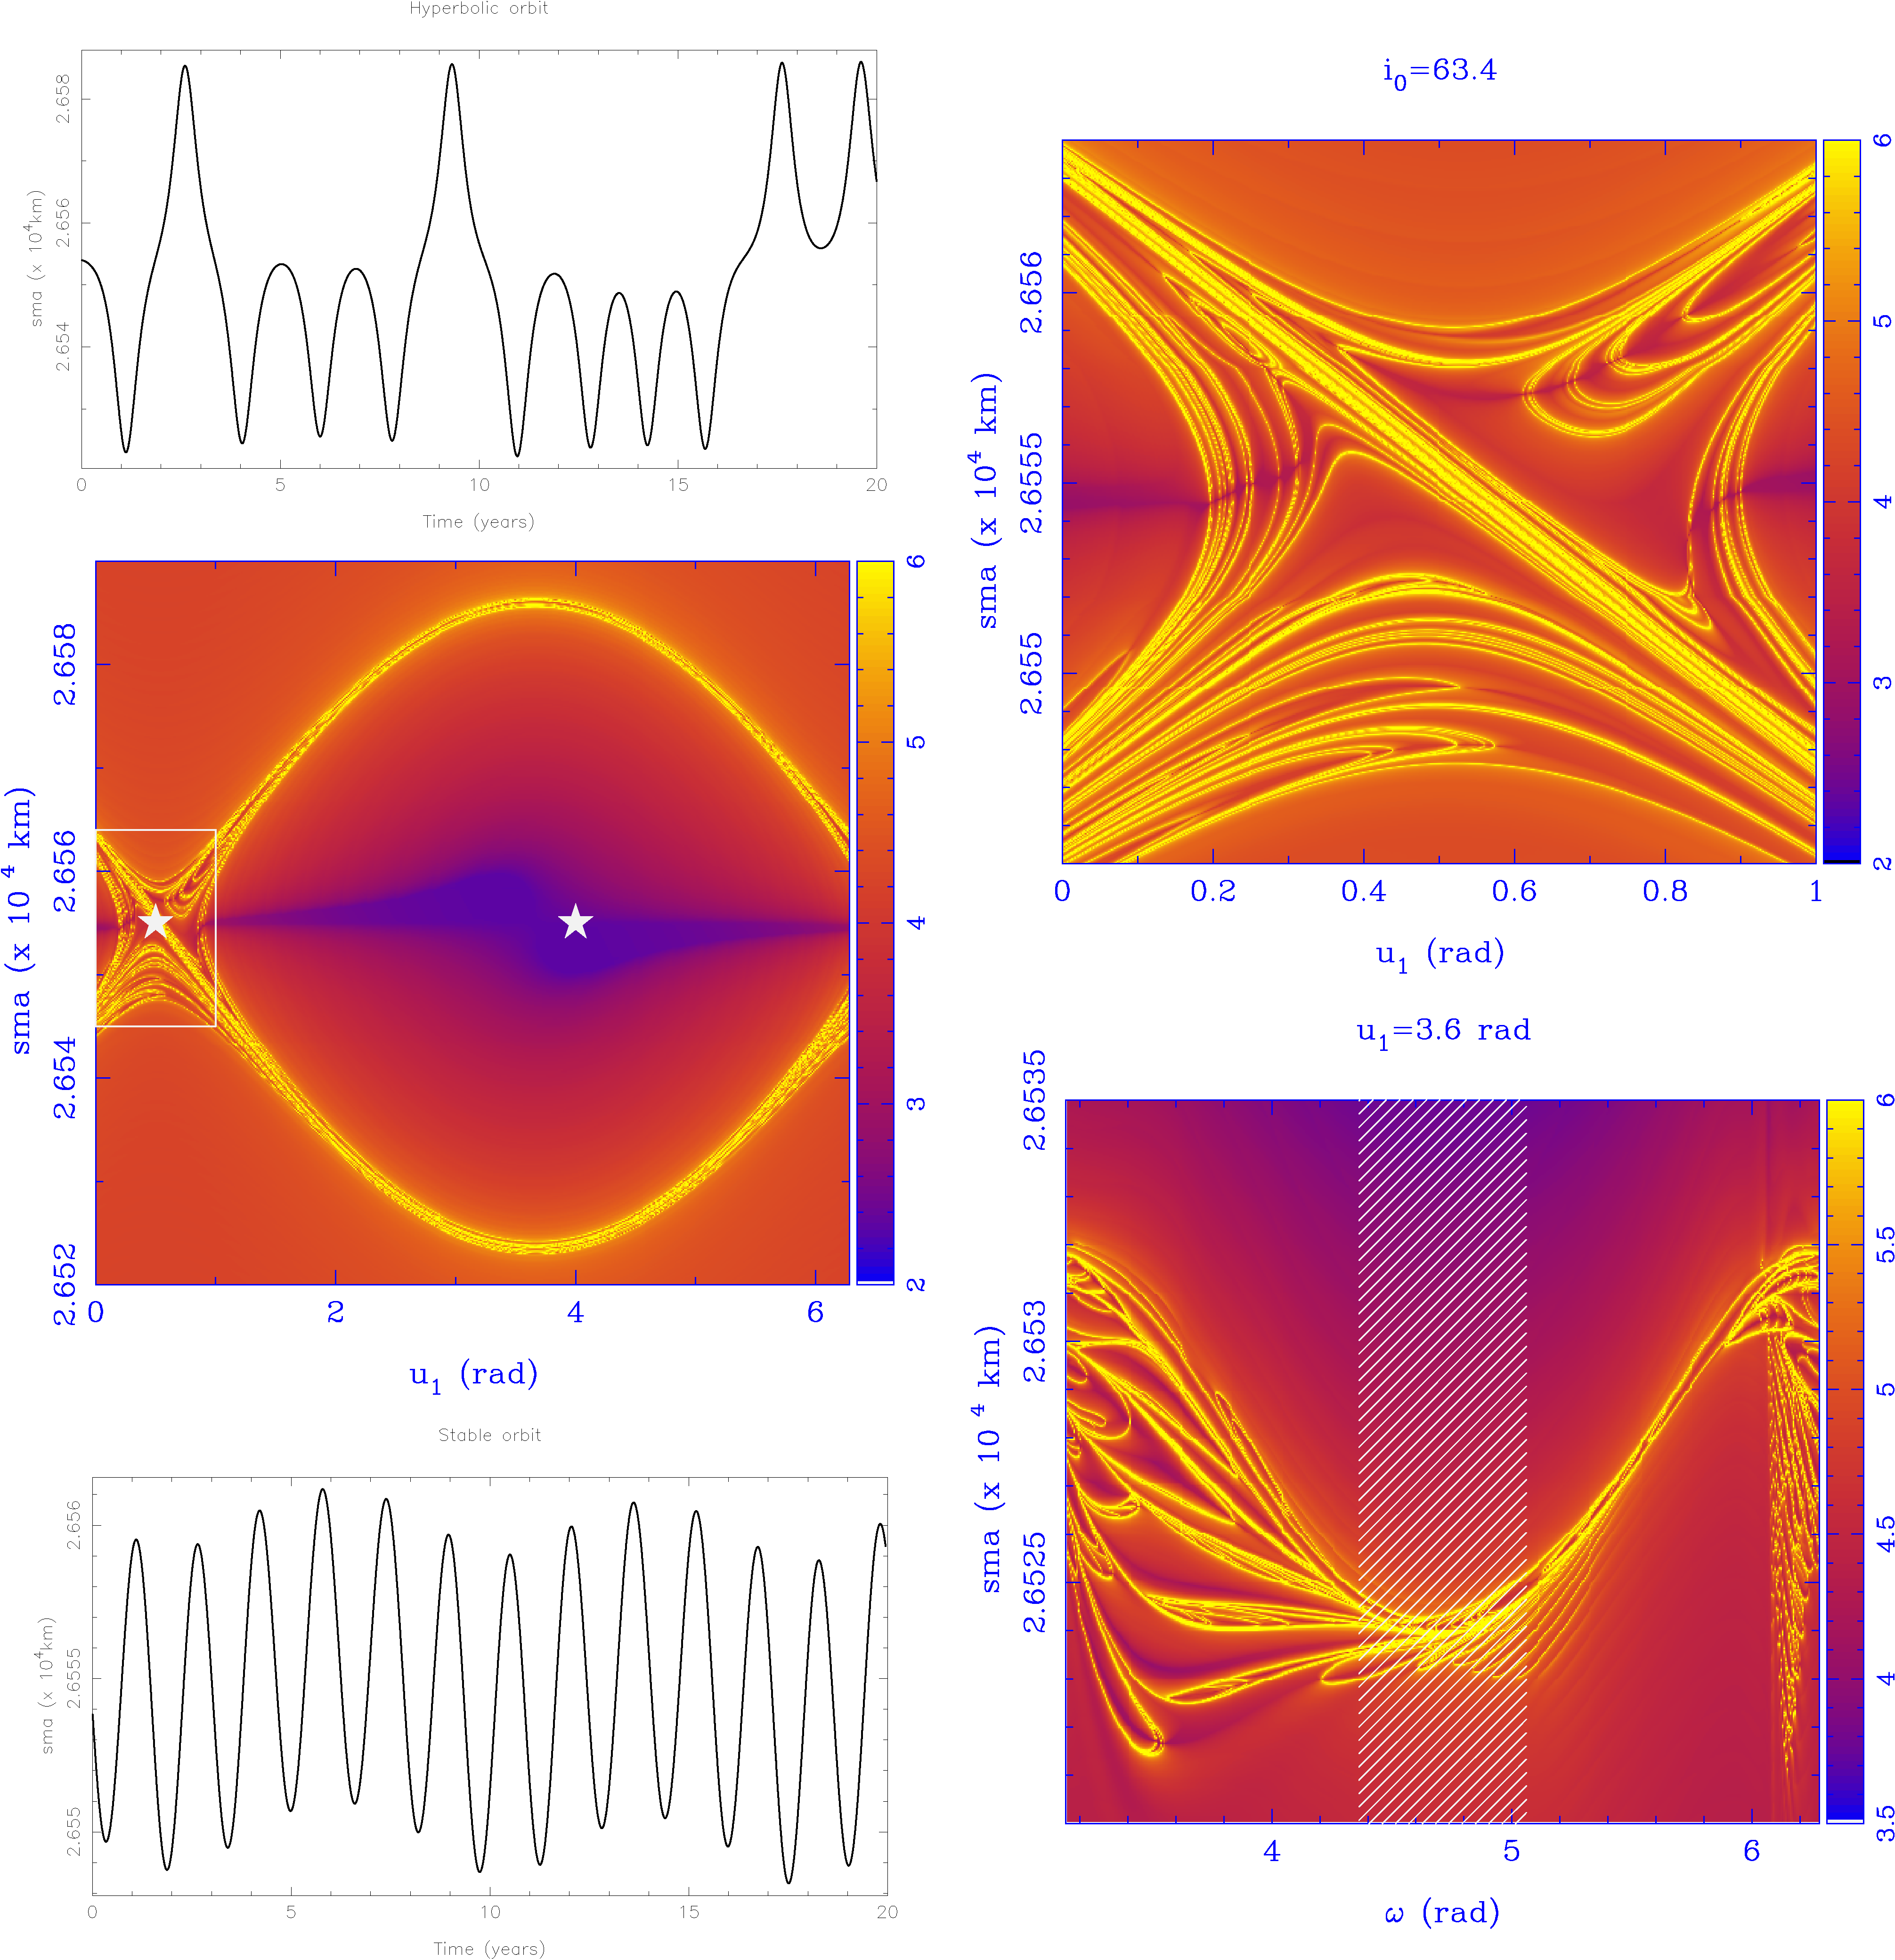
Figure 4 -
Composite plot highlighting the main features of Molniya semi-major
axis dynamics. The global FLI map and a magnified portion near the saddle-like
structure detail the hyperbolic structure. Initial conditions within the hyperbolic
layer display intermittency phenomena, whilst stable orbits display regular oscillations.
This is exemplified for two orbits whose initial conditions are labeled with the
white stars. The width of the layer, for a fixed u1 but varying ω, might exhibit a
complex geometry. For Molniyas prototypical range of values of ω, materialised by
the white shaded-line region around ω = 270o, the width is limited to a few kilometer
in the semi-major axis only. See text for details.
|
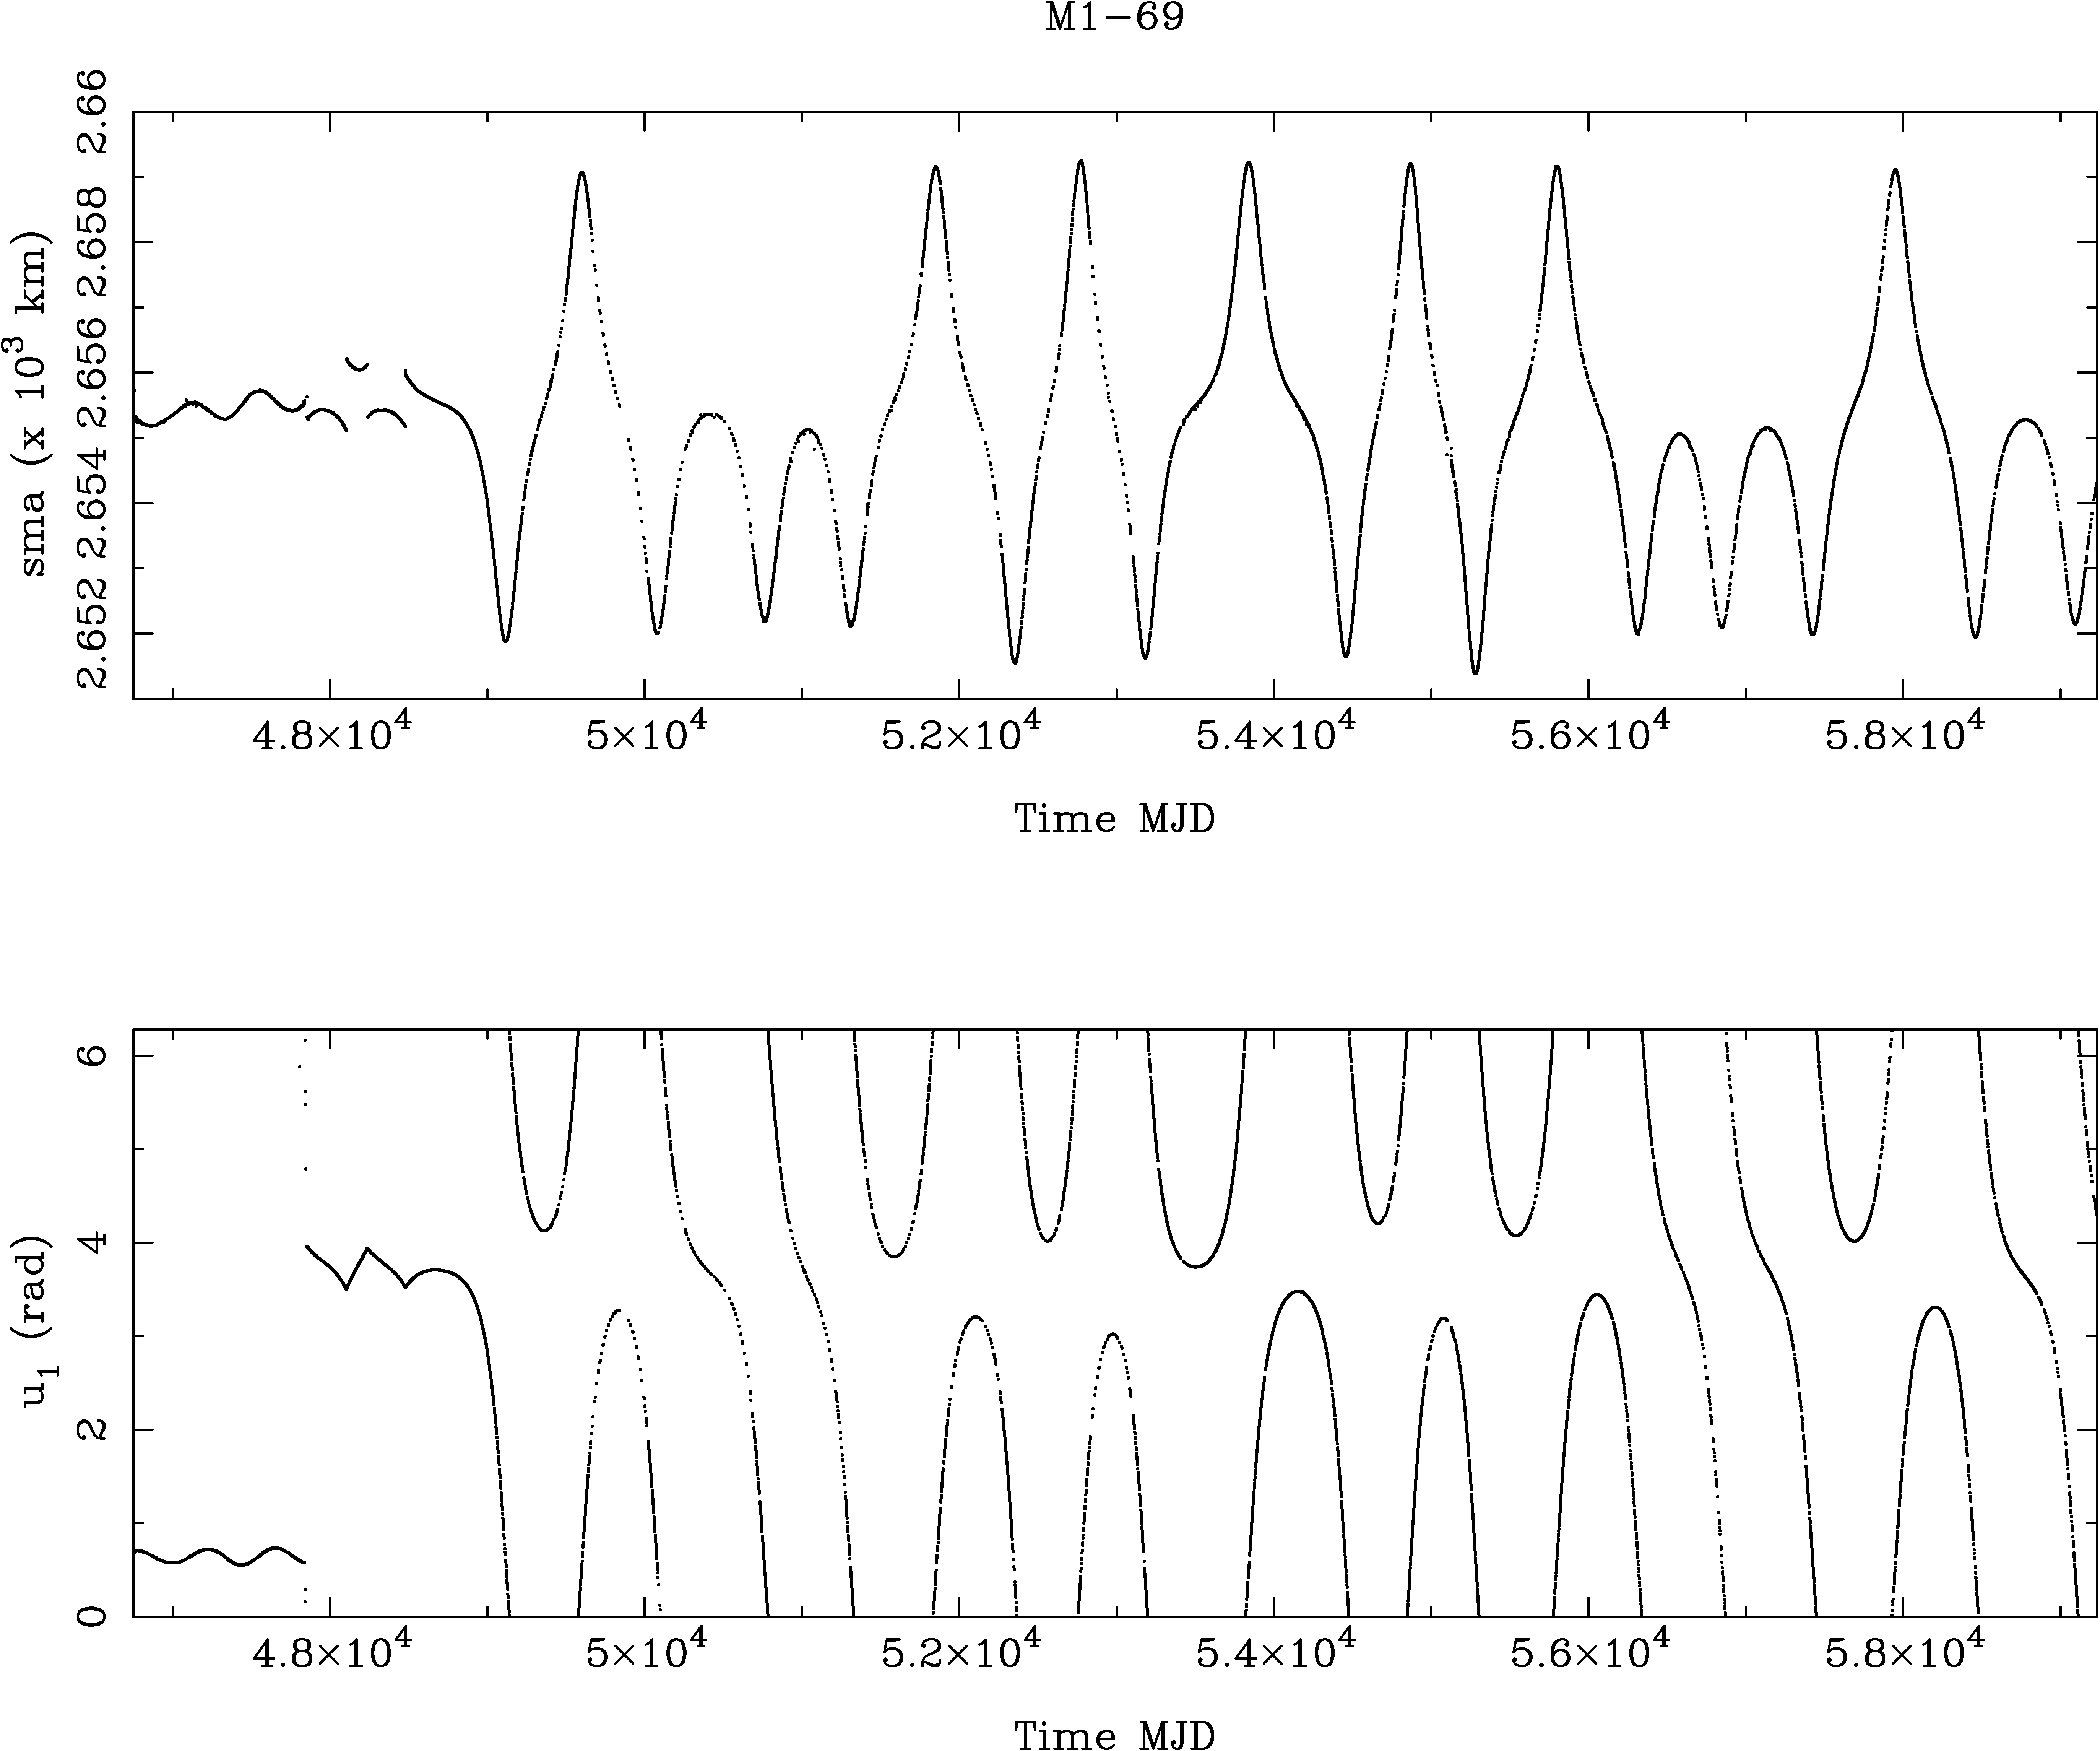 |
Figure 5 -
Time history of the semi-major axis and resonant angle u1 extracted from
the TLE data for the satellite Molniya 1-69.
|
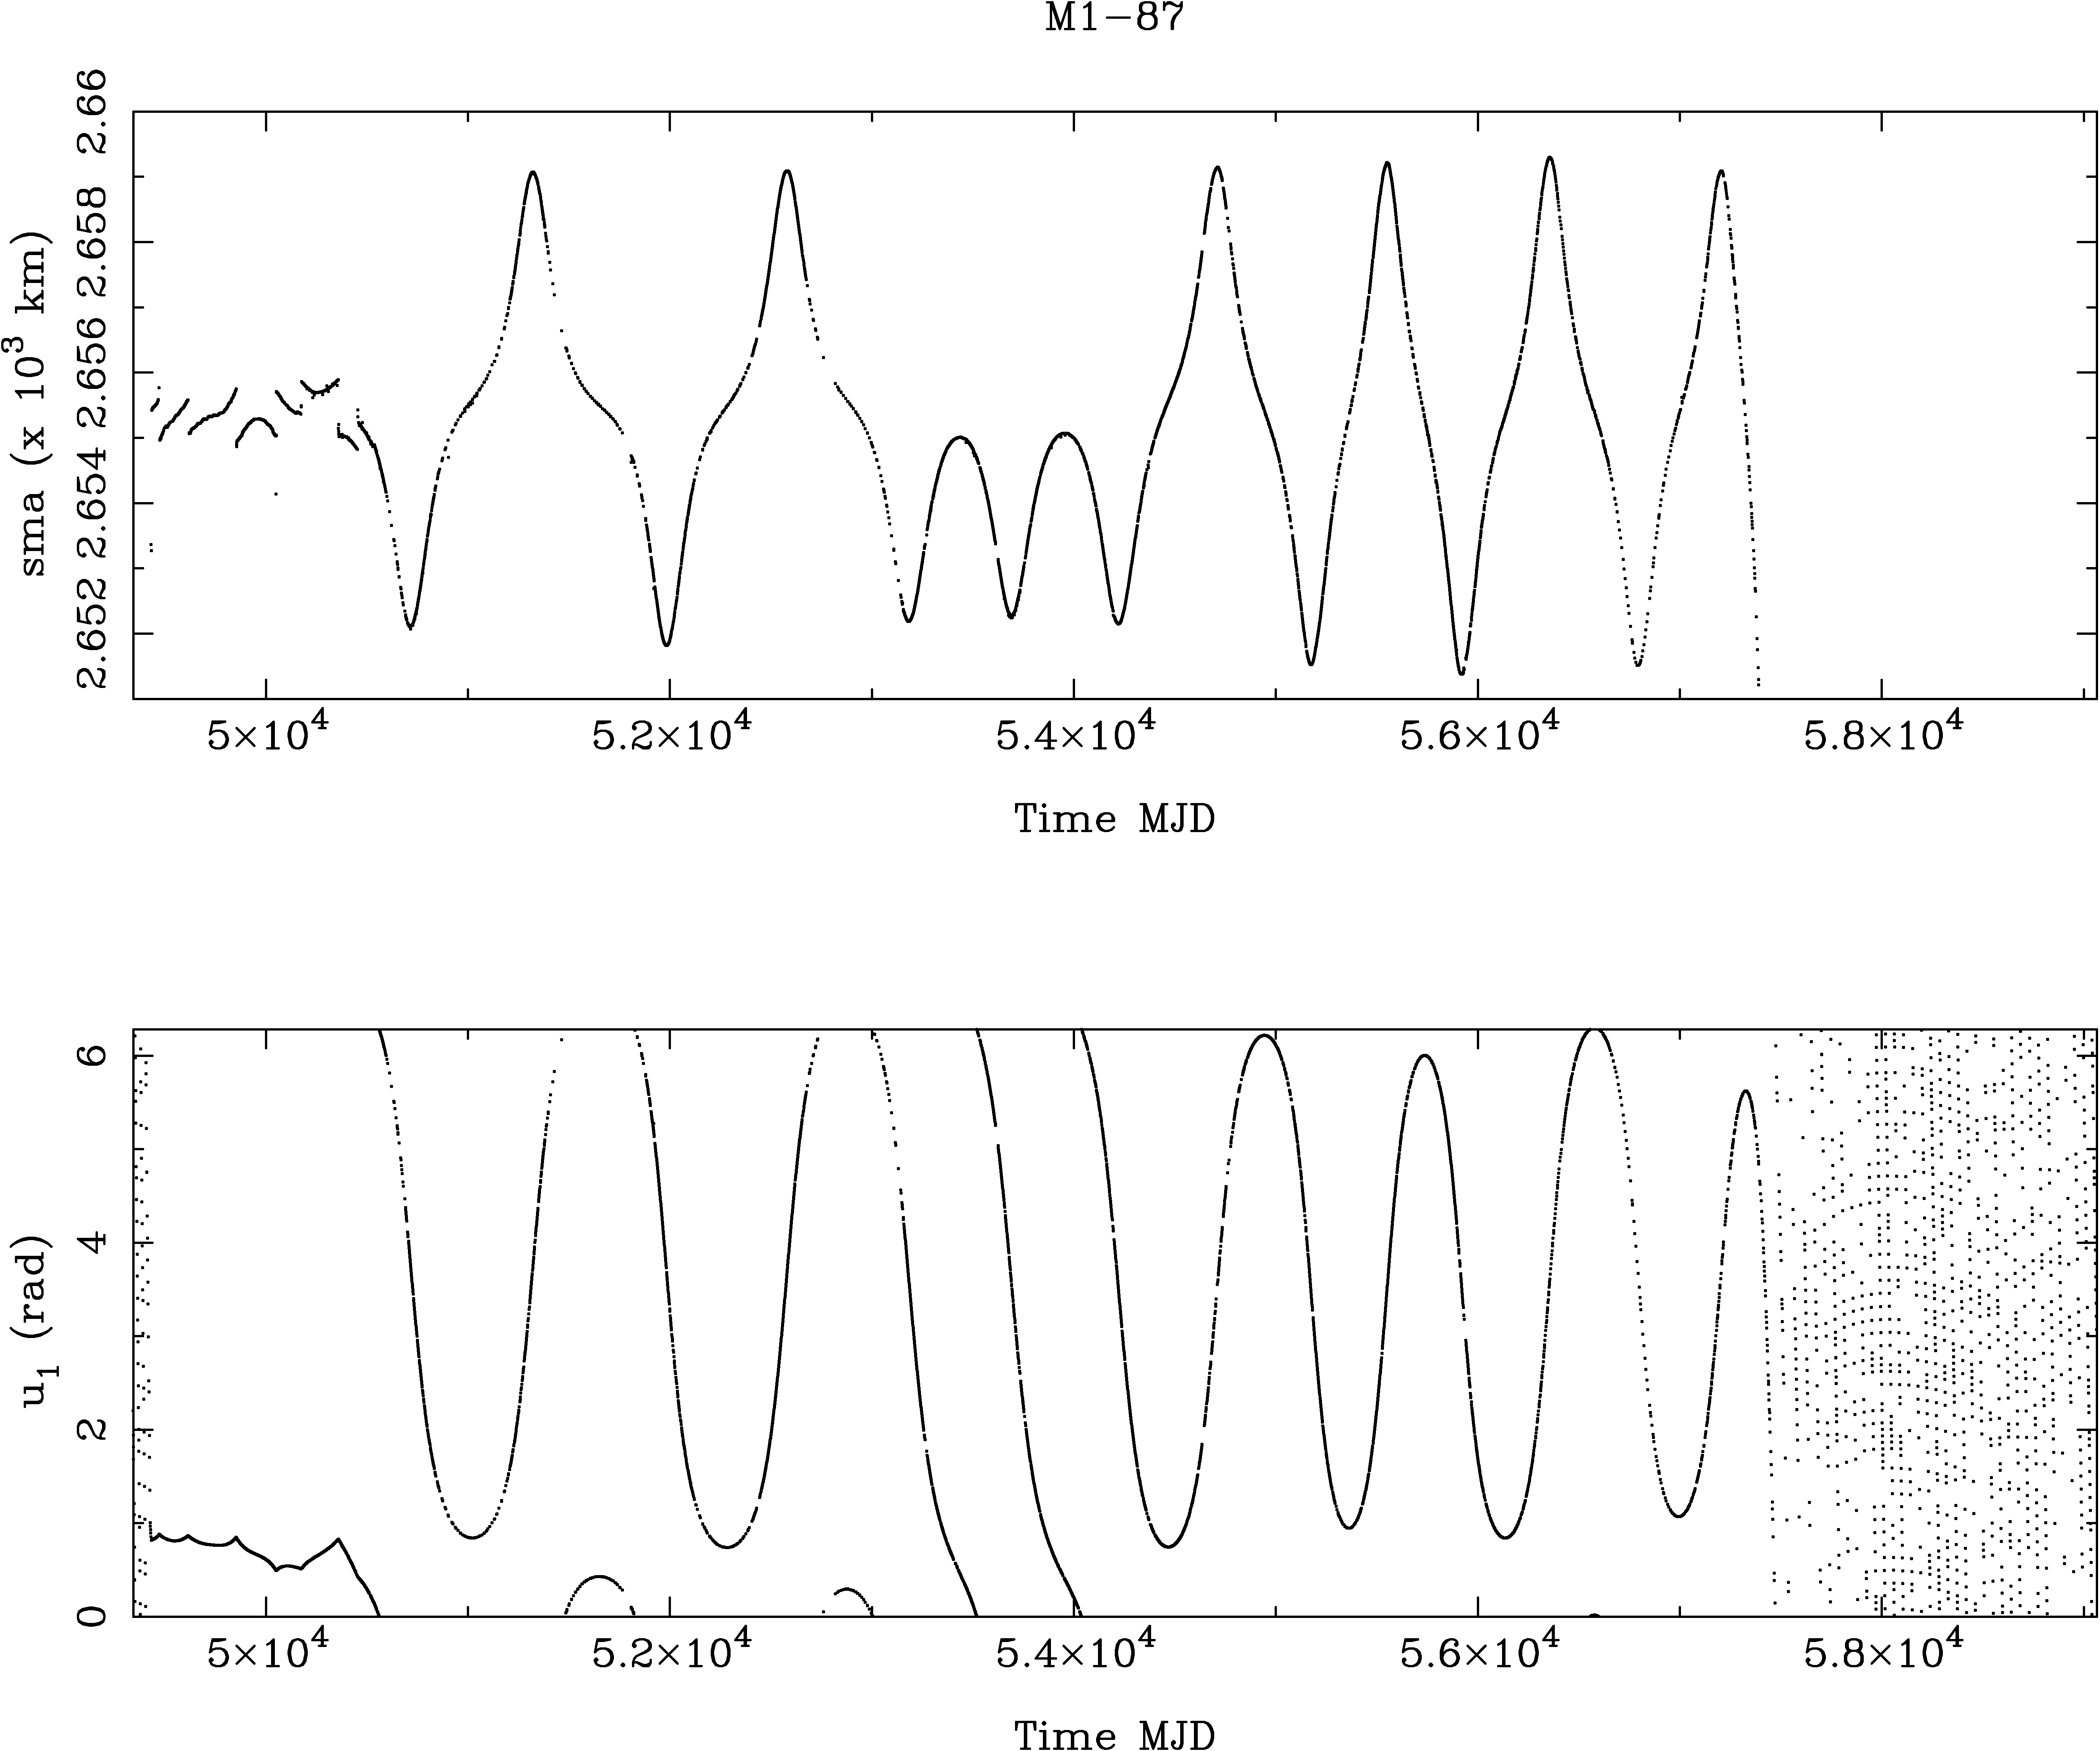 |
Figure 6 -
Time history of the semi-major axis and resonant angle u1 extracted from
the TLE data for the satellite Molniya 1-87.
|
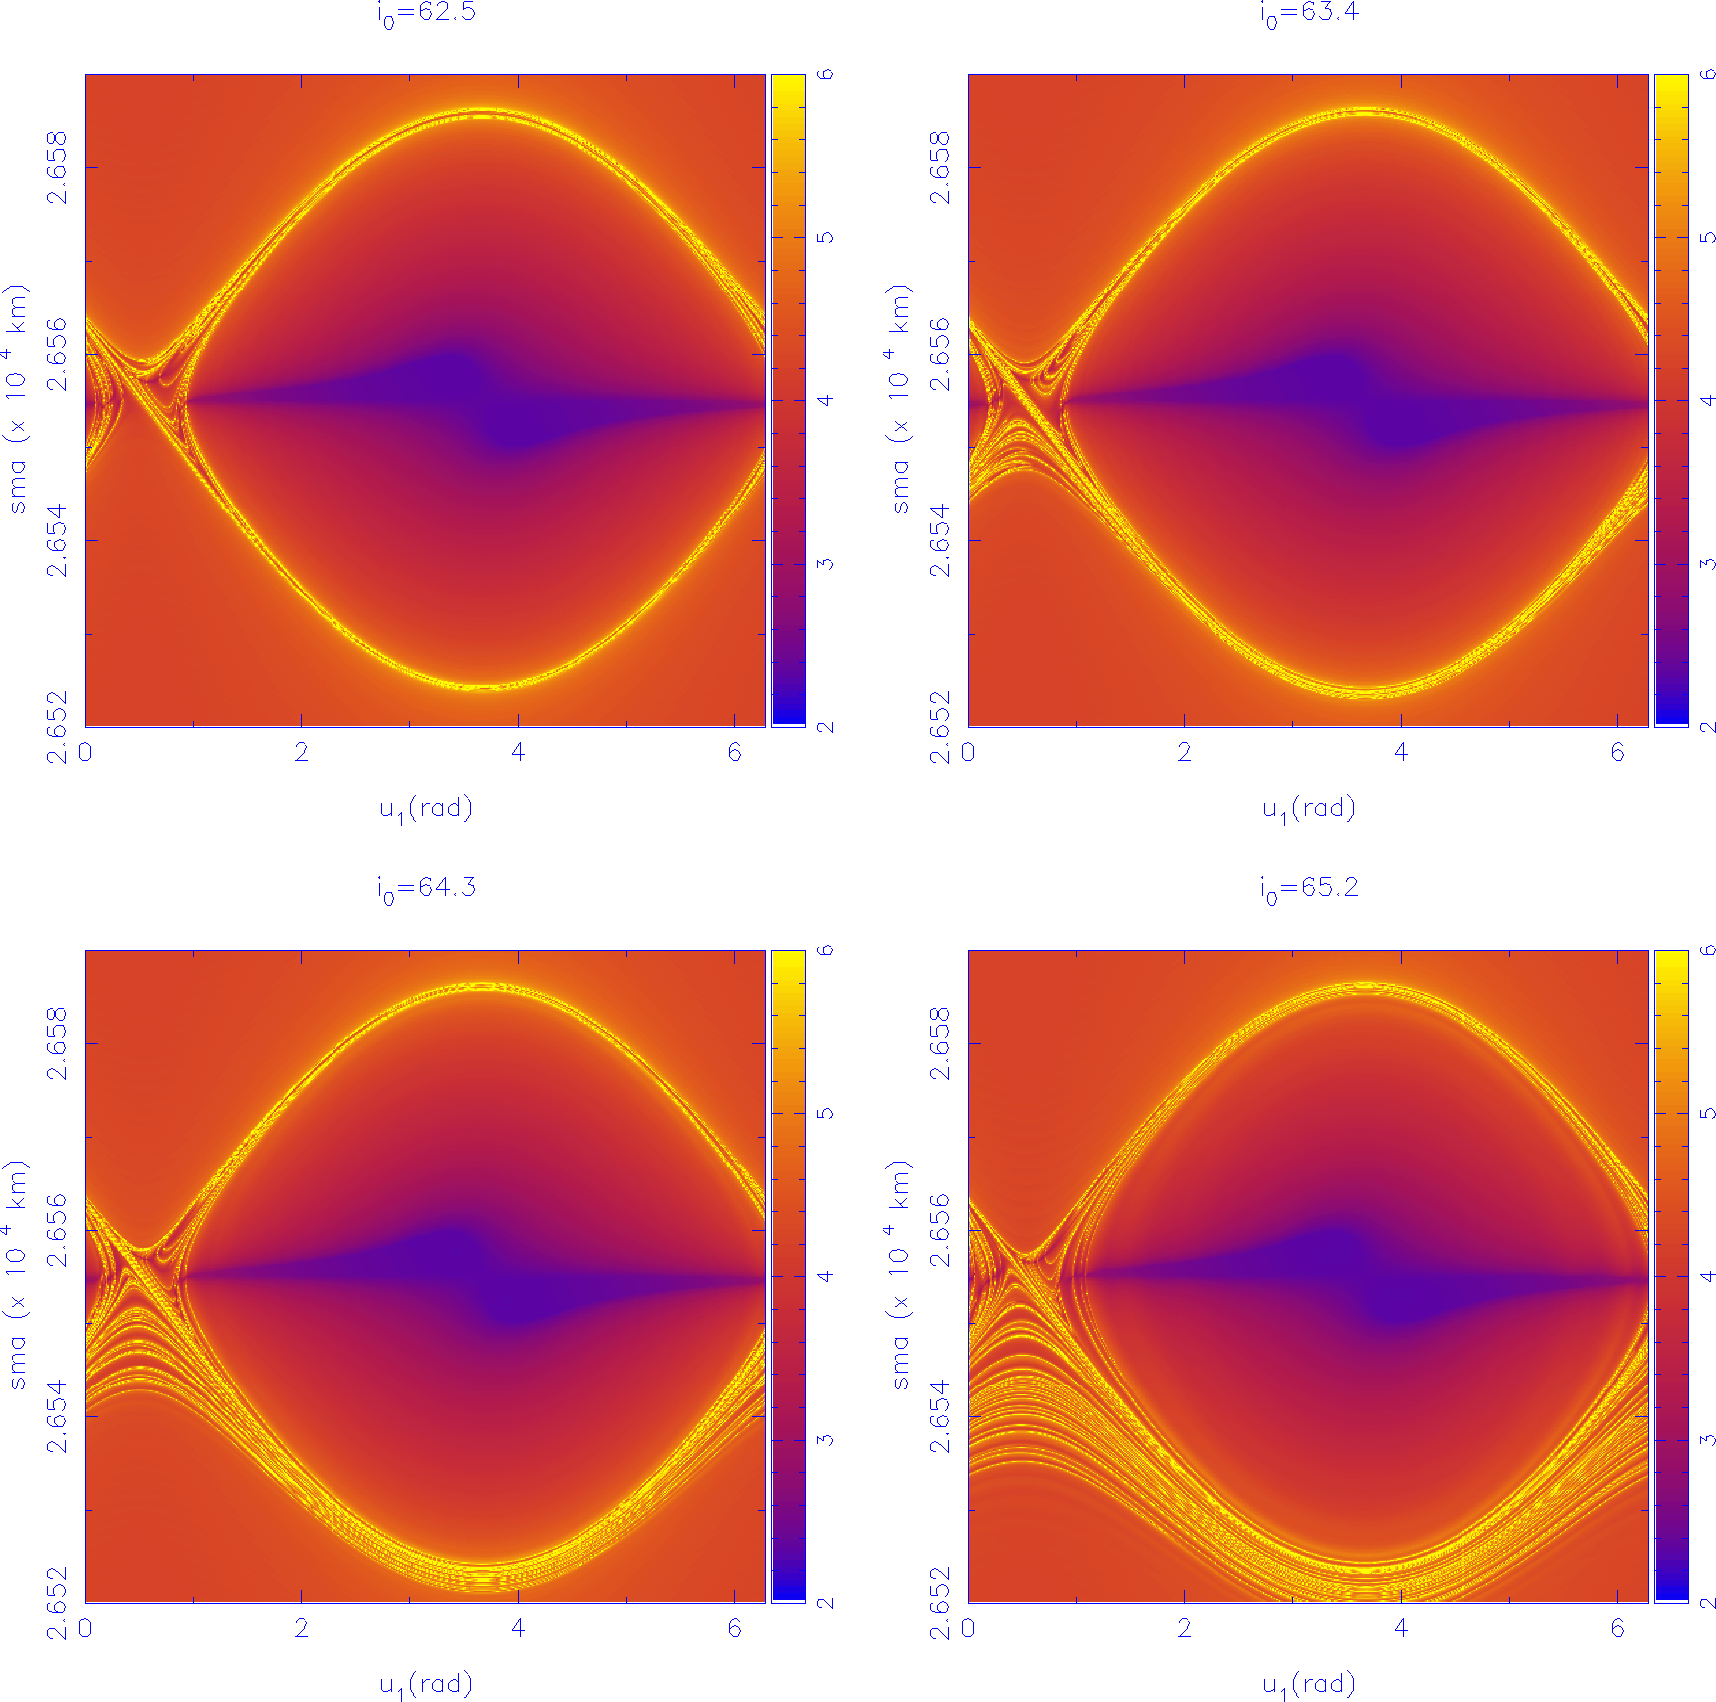 |
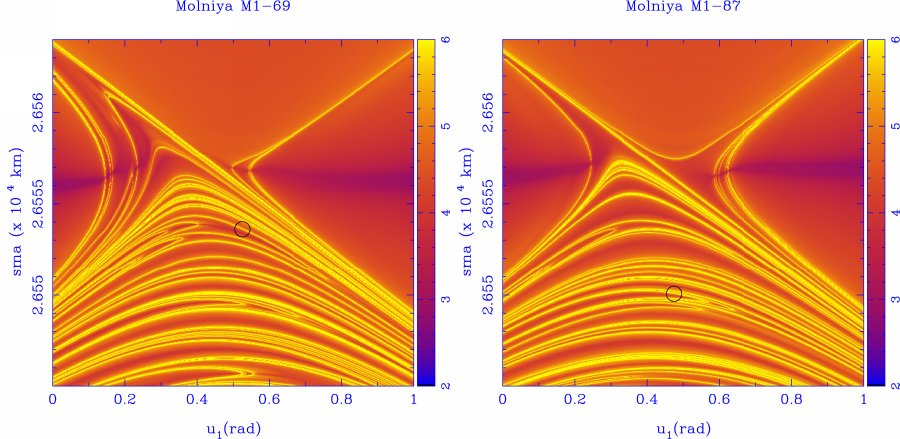
Figure 7 -
Dynamical maps for Molniya 1-69 and Molniya 1-87. The locations of
Molniya 1-69 and Molniya 1-87 are marked through the black circle. Both satellites
reside within the hyperbolic tangle.
|
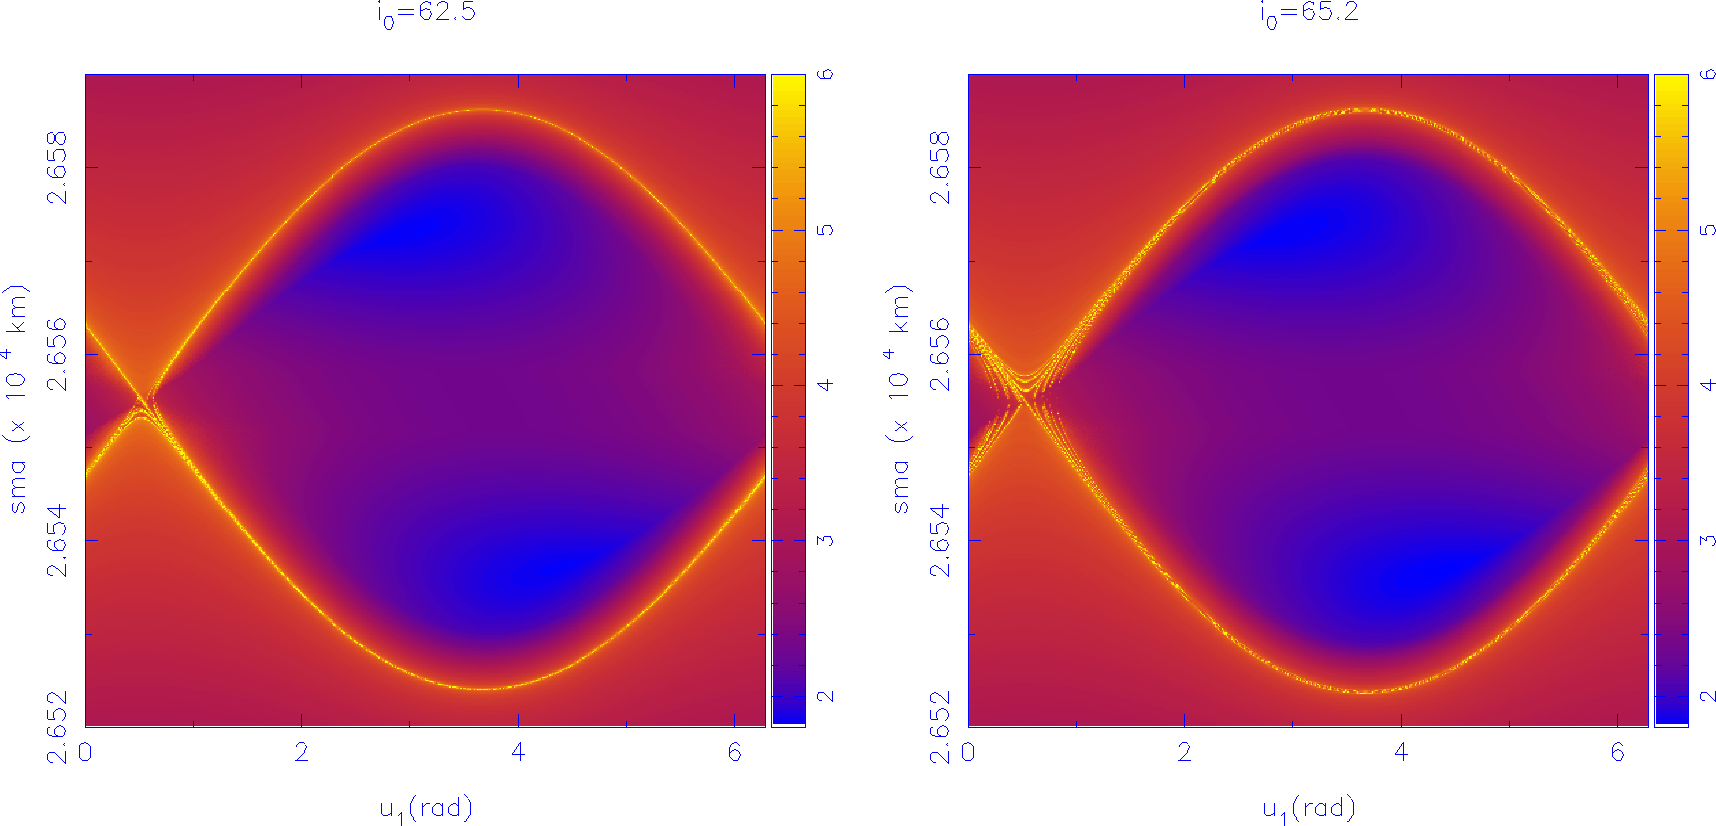 |
Figure 8 -
Intersections of the forward in time FLIs with the plane (a; u1) for model
S computed on a 500 × 500 grid of initial conditions for i0 ∈ {62.5; 63.4; 64.3; 65.2} deg.
|
 |
Figure 9 -
Intersections of the forward in time FLIs with the plane (a; u1) for model
J computed on a 500 × 500 grid of initial conditions for i0 ∈ {62.5; 65.2} deg.
|
| Tables | |
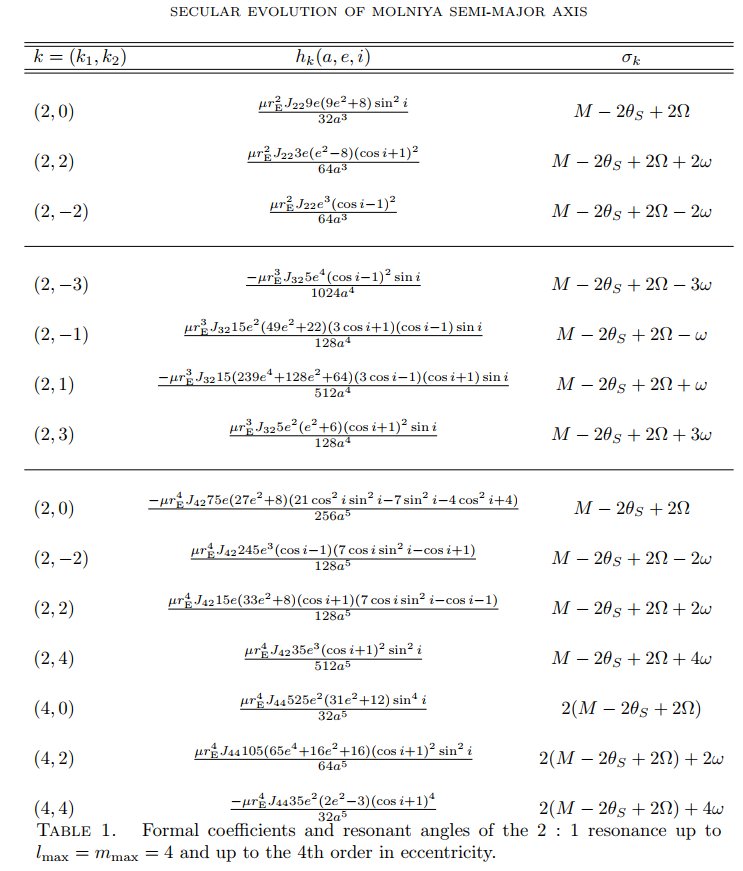 |
Table 1 -
Formal coefficients and resonant angles of the 2:1 resonance up to
lmax = mmax = 4 and up to the 4th order in eccentricity.
|
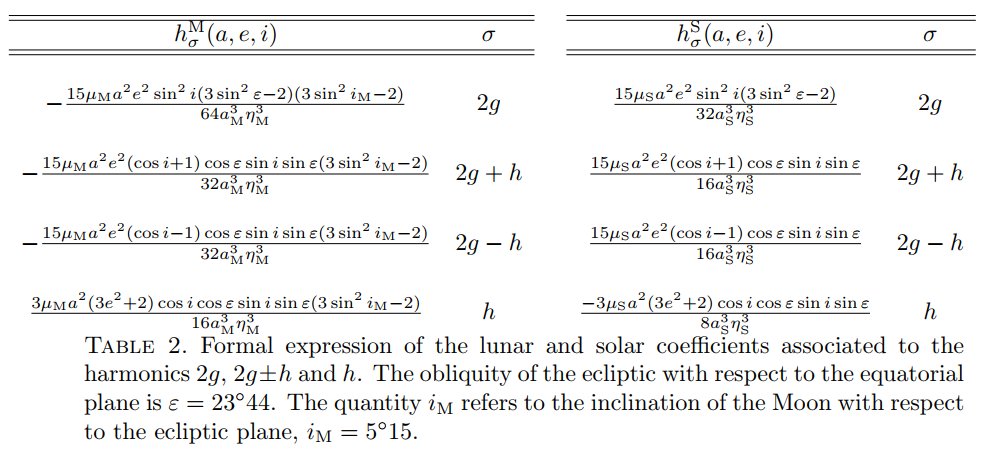 |
Table 2 -
Formal expression of the lunar and solar coefficients associated to the
harmonics 2g, 2g±h and h. The obliquity of the ecliptic with respect to the equatorial
plane is ε = 23o44. The quantity iM refers to the inclination of the Moon with respect
to the ecliptic plane, iM = 5o15.
|
Back to article listing |
|
Shortcut to Space Stuff |
| AB/Apr 2023 |
|
|