
Galactic Center |
47-Tuc |
NGC 1569 |
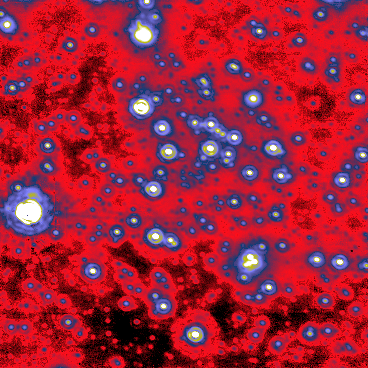
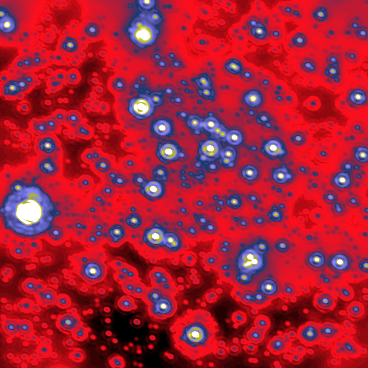
The code has been run on a K-band PUEO image of the Galactic Center (Fig.1), kindly provided by François Rigaut. The image is an example of a well-sampled high-Strehl AO observation of a stellar field.
The total field of view is about 13X13 arcsec2 and the pixel size 0.035 arcsec/pixel.The PSF is nearly stable across the image, apart from some minor features especially on the shape of the first diffraction ring. We will show that assuming a constant PSF it is possible to obtain accurate results. About 1000 stars have been detected, with a correlation coefficient of at least 0.7; the reconstructed image is shown in Fig.1
 |
 |
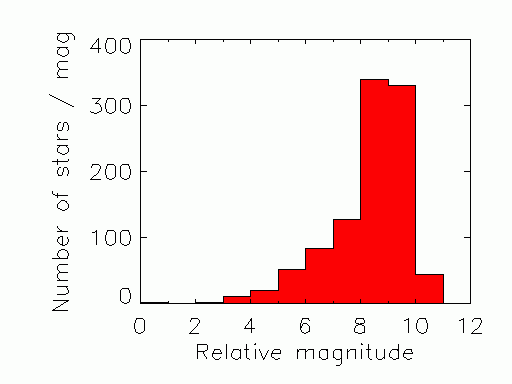
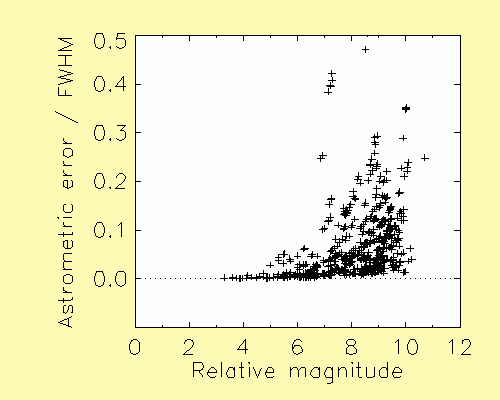
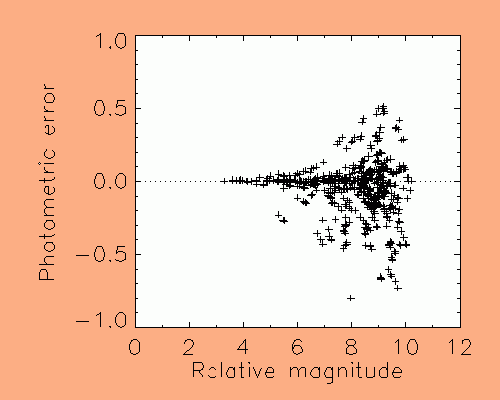
We have evaluated the astrometric and photometric accuracy of the code by means of an experiment with synthetic stars: for each magnitude bin in the retrieved luminosity function (Fig. 2), a total of 10% synthetic stars at random position have been added to the image.In practice 10 frames have been created with this procedure and analyzed separately. The catalogues of detected artificial stars for each frame have been merged together; then the astrometric and photometric errors have been computed and plotted as a function of the true magnitude (Fig.3)
The plots show accurate astrometry and photometry and there is no apparent photometric bias. It is interesting to consider the accuracy for the stars brighter than a relative magnitude of 5: the mean astrometric error is <0.5 mas and the mean absolute photometric error is <0.01 mag. The artificial sources are contaminated by the background noise already present in the observed data and by the photon noise due to neighboring stars; no additional photon noise has been added, so the error estimates should be regarded as lower limits.
 |
 |
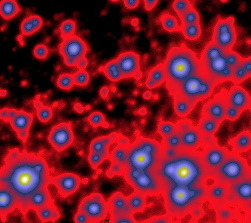
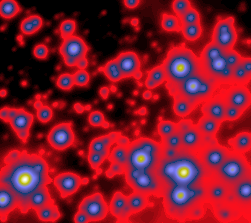
A completely different example is represented by the H-band image of the globular cluster 47Tuc, observed at the ESO 3.6m telescope with the ADONIS AO system (Fig.4). The image has low Strehl ratio and is very well sampled with a FWHM of about 6 pixels (1 pixel = 0.1 arcesec).
|
 |
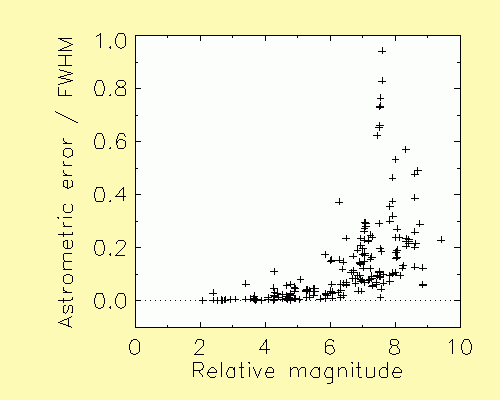
As in the previous high-Strehl case, we have evaluated the accuracy of the algorithm by means of an experiment with synthetic stars. The astrometric and photometric errors for the detected artificial sources are shown in Fig.5. About 40% of the detected synthetic stars have an astrometric error smaller than 0.1 PSF FWHM and photometric accuracy better than 0.1 mag; in the previous example the corresponding percentage is 56%: we attribute the lower accuracy in the low-Strehl case to the worse image quality.
 |
 |
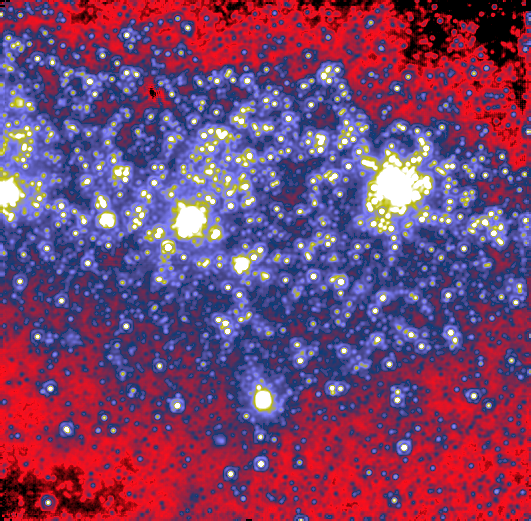
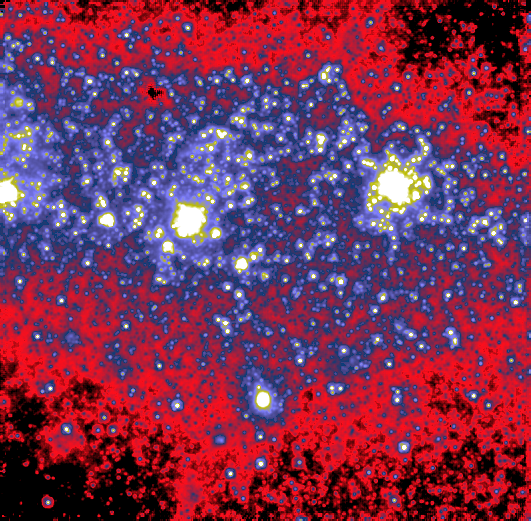
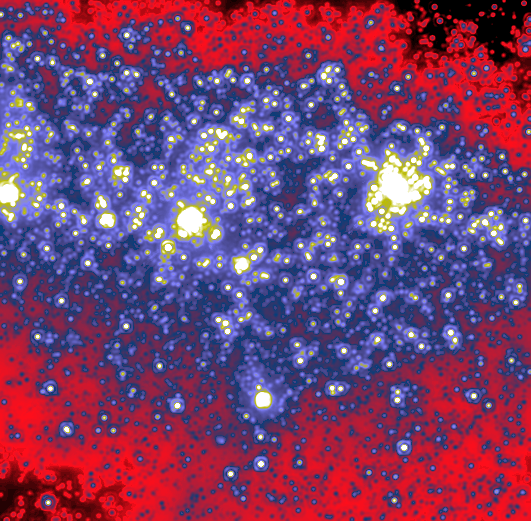
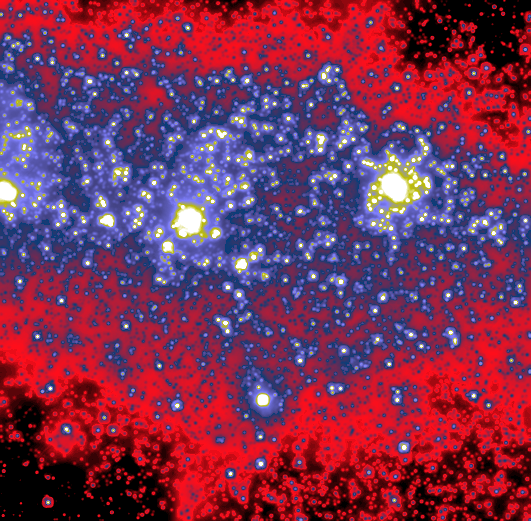
The last application concerns a HST observation of the starburst galaxy NGC 1569,observed with the NICMOS camera in the F110W and F160W filters, roughly correspondingto the standard J and H bands. The originally under-sampled dithered frames have been combined with the Drizzle code, obtaining two well-sampled images which have been analyzed independently. In the F160W frame, thanks to the finer sampling of the PSF, it has been possible to apply the de-blending strategy based on the recognition of blends by their larger extension as compared to the PSF. The two images, along with the corresponding reconstructions, are shown in the next Figure.
 |
 |
 |
 |
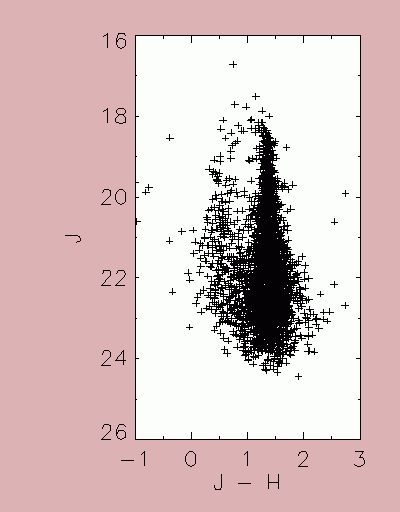
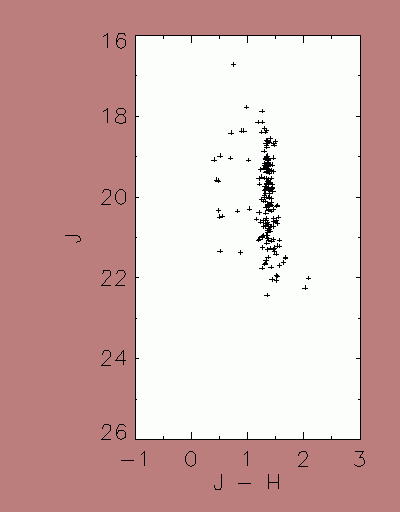
The lists of the detected stars have been compared by matching the corresponding reference frames and retaining all the objects with a relative offset smaller than 1/2 pixel. A subset of the 3133 retrieved common stars has been created selecting the sources with a very high (more than 0.975) correlation coefficient: high values of this parameter are generally associated to resolved single stars. The two calibrated CMDs, with the complete set of 3133 objects and the selected one including 195 stars, are shown in Fig. 7.
|
|
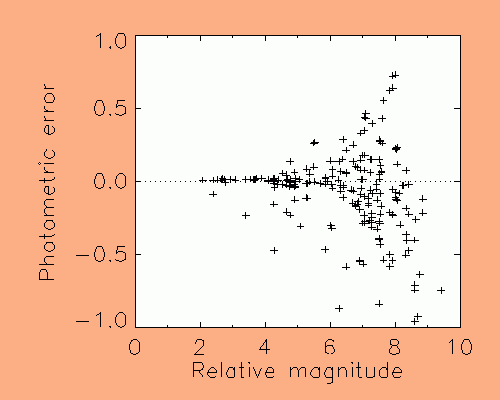
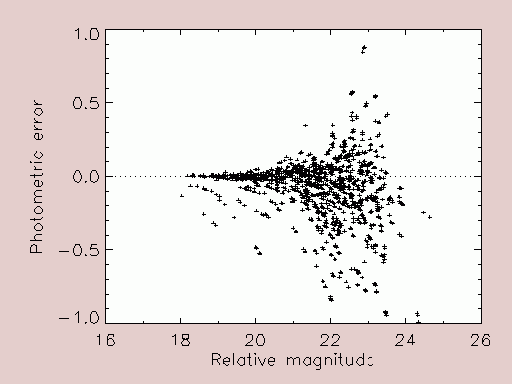
The photometric accuracy has been evaluated by means of an experiment with synthetic stars, similar to those performed in the previous applications. The photometric errors for the successfully detected synthetic sources in the F110W filter are plotted in Fig. 8; similar results have been obtained for the F160W frame. The slightly higher number of negative errors may be attributed to the extreme crowding of this field: when a synthetic star falls on a fainter source, the latter might be lost whereas the luminosity of the former might be overestimated.

[Home|Authors |Presentation|Analysis |Fitting|Applications| IDL code]