Back to article listing

Back to article listing |
 |
Shortcut to the SSP models |
| Buzzoni, A., & Gónzalez-Lópezlira, R.A.: | |||
| "AGB Connection and Ultraviolet Luminosity Excess in Elliptical Galaxies", 2008, Astrophysical Journal, 686, 1007 | |||
|
|
Summary:
Relying on infrared surface brightness fluctuactions to trace AGB
properties in a sample of elliptical galaxies in the Virgo and Fornax clusters,
we assess the puzzling origin of the "UV-upturn" phenomenon, recently
traced down to the presence of a hot horizontal branch (HB) stellar component.
We find that the UV-upturn actually signals a profound change in the c-m
diagram of stellar populations in elliptical galaxies, involving both the
hot stellar component and red-giant evolution. First, we encounter that the
strengthening of the UV rising branch is always seen to correspond to
a shortening in AGB deployment; this trend can be readily interpreted as an age
effect, perhaps mildly modulated by metal abundance.
A comparison between galaxy Keff magnitudes and population synthesis
models confirms that, all the way, brightest stars in ellipticals are genuine AGB
members, reaching the thermal-pulsing phase, and with the AGB tip exceeding the
RGB tip by some 0.5-1.5 mag. The inferred core mass of these stars is found to be
≤ 0.57 Msun among giant ellipticals.
Coupled with the recognized severe deficiency of planetary nebulae in these galaxies,
this result strongly calls for an even more critical blocking effect due to a
lengthy transition time needed by the post-AGB stellar core to become a hard UV emitter
and eventually "fire up" the nebula.
The combined study of galaxy (1550 − V)o color and integrated
Hβ index points, as an explanation for the UV-upturn phenomenon, to
a composite HB with a bimodal temperature distribution, i.e. with both a red
clump and an extremely blue component, in a relative proportion of roughly
[N(RHB):N(BHB)]~[80:20]. As far as metallicity of the BHB stellar population is
concerned, we find that [Fe/H] values of either ~ -0.7 dex or ≥ +0.5 may
provide the optimum ranges to feed the needed low-mass stars (M* « 0.58 Msun),
that at some stage begin to join the standard red-clump stars.
|
| Pick up the paper at Astro-ph/0806.2658 | Local link to the PDF version (600 Kb) | ||
| HTML version at the ApJ site (*) | PDF file at the ApJ site (*) | ||
| (*)Requires access password |
| ||
|
 |
Figure 1 -
An illustrative V vs. B−V synthetic c-m diagram for a 15 Gyr SSP of solar
metallicity and Salpeter IMF, with big dots identifying
the different "effective contributors" (i.e., the appropriate magnitude
M ≡ Meff) at various photometric bands
(and to bolometric luminosity, as well). Although the different effective magnitudes cannot
univocally be attributed to any B−V color, one could let the prevailing stellar
contributors to bolometric, infrared, and visual fluctuations arbitrarily coincide with the
corresponding RGB location in the c-m diagram. This is not the case
for the $U$ band, where the effective magnitude comes
from a more entangled mix of HB, red giants, and bright main sequence (MS) stars
about the turn-off region of the diagram.
|
 Fig.2a Fig.2a
|
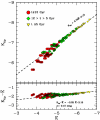
Figure 2 -
Theoretical relationship between near-IR effective magnitude and AGB+RGB tip luminosity,
for a full collection of SSP models from Buzzoni (1989) (upper panel), and
Charlot & Bruzual (Bruzual 2007) (lower panel).
Population ages span from 1 Gyr (upper right) to 18 Gyr (lower left); metallicity ranges
between 0.0001 ≤ Z ≤ 0.05. The Buzzoni (1989) models explore a
Reimers (1975) mass-loss parameter η = 0.3 and 0.5 for a Salpeter IMF,
while the Charlot & Bruzual calculations adopt the mass-loss rates derived by Marigo & Girardi (2007)
and use a Chabrier (2003) IMF. Dashed lines indicate fits to all points. Besides the
overall agreement between the two synthesis codes, one has to notice a
larger scatter around the mean relation for the CB07 models, mainly due to a different response
to SSP metallicity at younger ages.
|
 |
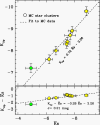
Figure 3 -
Absolute Ktip vs. Kseff magnitude relationship
for Magellanic Cloud star clusters. Big dots locate the average position for
each "supercluster" of Table 1, i.e. a co-addition of several individual systems
belonging to homogenous Searle et al. (1980) age classes.
The dashed line is the fit to the data, as displayed on the plot. Color code for
markers is like in Fig. 2.
|
 |
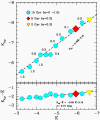
Figure 4 -
Theoretical relationship between Ktip and Keff with varying mass loss
efficiency along red-giant evolution. Big dots trace
the change in a 15 Gyr old SSP of solar metallicity Buzzoni (1989), with
the increase of Reimers mass-loss parameter η from 0 to 1.5, as labelled on the
plot. Note that a reduced mass loss (η → 0) leads old SSPs to fully deploy
the AGB and closely resemble much younger 2-5 Gyr old SSPs (triangles and
diamond markers on the plot) with η = 0.3 and otherwise same distinctive parameters.
|
 |
Figure 5 -
Theoretical Keff and Ktip relationship with increasing mass-loss
rate along red-giant evolution. The illustrative case of a 15 Gyr old SSP of solar
metallicity, after Buzzoni (1989), is considered. Note that, for η ≤ 0.4,
the AGB luminosity tip is
brighter than the RGB and PNe are produced; if mass loss increases, then AGB luminosity is further
reduced (and PN formation correspondingly thwarted), until stars at the RGB tip begin to dominate
as the brightest objects in the population (η ≥ 0.5). For even higher
mass-loss rates (η ≥ 0.8) stars undergo incomplete RGB evolution, leaving
the branch "midway" and igniting helium at a higher effective temperature (hot flashers).
|
 |
Figure 6 -
Absolute fluctuation magnitudes vs. ultraviolet color (1550−V)
for the galaxy sample of Table 2. Both Kseff and (1550−V) have been duly
corrected for Galactic reddening. Triangles mark galaxies with Kseff extrapolated
from F160Weff, as explained in footnote 8. Note the outlying cases of
NGC 1387, NGC 4552, and NGC 1389 with an infrared effective magnitude that
is ~0.7 mag too bright for their UV excess.
The relevant case of the merger radio-galaxy NGC 1316 (Fornax A) is also singled out in
the plot, where the arrow indicates that a "bluer" (1550−V) color might be more appropriate
for this galaxy (with a more negligible impact on Kseff, though), as a consequence
of a strong internal absorption due to the observed presence of dust lanes. Excluding these
controversial objects (discussed in more detail in Sec. 4), the data sample
correlates fairly well (ρ = -0.75, see arrow), indicating a less
deployed AGB for UV-enhanced galaxies.
|
 |
Figure 7 -
Absolute fluctuation magnitudes vs. velocity dispersion
for the galaxy sample of Table 2. Squares mark galaxies with Kseff extrapolated
from F160Weff, as explained in footnote 8.
|
 |
Figure 8 -
The luminosity-specific PN number (α) vs. effective K
luminosity for the galaxy sample of Table 2. The triangles mark galaxies with Kseff
inferred from F160Weff (see footnote 8). Note that a fainter AGB roughly correlates with
a scantier PN stellar population among old/metal-rich (UV-enhanced) ellipticals, as expected
from the long post-AGB to PN nucleus transition time, combined with the (shorter) evaporation timescale of the ejecta
(compare the sketch on the plot with Fig. 15 in Buzzoni et al. 2006, for a full discussion).
A correspondingly low PN rate per unit galaxy luminosity is also to be expected, on the other hand,
for younger stellar populations, as in the case of NGC 1316, as a consequence of higher stellar
masses and a reduced PN nuclear lifetime.
|
 |
Figure 9 -
Lick Hβ index vs. (reddening corrected) UV color (1550−V)o,
for the galaxy sample in Table 2. Three reference SSP models are superposed,
after Buzzoni (1989), exploring different HB morphologies (namely a red, RHB,
an intermediate, IHB, and a blue, BHB, temperature distributions,
as explained in the text), assuming a 15 Gyr,
slightly metal-rich ([Fe/H] = +0.2) and with a fixed Reimers mass-loss parameter
(η = 0.3) stellar population. Note that the bulk of "UV-upturn" ellipticals
need a mixture of blue and red HB stars, roughly in a proportion of [N(RHB):N(BHB)] = [80:20],
as marked by the big triangle in the plot. For this composite stellar population, Fig. 10 reports the
resulting synthetic c-m diagram and the integrated SED.
|
 Fig.10a Fig.10a
|
Figure 10 -
Upper panel - Synthetic c-m diagram for the reference composite stellar
population matching "UV-upturn" ellipticals, as discussed in Fig.~9 (the corresponding big
triangle in the plot), after Buzzoni (1989).
The resulting mix assumes a bimodal HB morphology, with a prevailing bulk of red HB (RHB) stars and
a hot tail (BHB), extending up to Teff ~ 40000 K. The RHB stellar component
provides about 80% of the total luminosity. An age of 15 Gyr is assumed in all cases, with a moderately
metal-rich chemical composition (i.e. [Fe/H] = +0.2), a Salpeter IMF, and a fixed Reimers
mass-loss parameter η = 0.3.
A Poissonian error is artificially added to the data to better appreciate the number density
distribution of stars along the different evolutionary branches of the diagram.
The integrated SED of the whole population is displayed in the lower panel, disaggregating
the luminosity contribution from the two star samples.
|
 |
Figure 11 -
The expected representative stellar mass at the onset of the HB evolution
for Buzzoni's (1989) 15 Gyr SSP models with different metallicity and mass-loss rate, according to
a Reimers parameterization (η). In combination with a moderately enhanced
(η ~ 0.5 or higher) mass loss, two preferred ranges of metallicity (namely
[Fe/H] ~ -0.7 dex and > +0.5) may more easily favor the presence of low HB
masses (MHB ≤ 0.58 Msun, see dashed line in the plot) and
the corresponding appearence of a hot-temperature tail in the HB morphology.
|
 |
Figure 12 -
Ktip vs. Lick Mg2 index, for the galaxy sample in
Table 2. The Lick index is assumed to trace galaxy metallicity according to
the Buzzoni et al. (1992) calibration, as reported on the top axis of the plot.
The observed decrease in Ktip with increasing [Fe/H] can be mostly explained if
more metal-rich galaxies are also older, as in a standard monolythic scenario for galaxy formation.
The dashed line on the plot marks the minimum luminosity required for stars to
experience the thermal pulsing phase along their AGB evolution, and thus end their evolution
as PNe.
|
 |
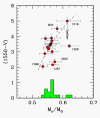
Figure 13 -
Observed ultraviolet color (1550−V) vs. core mass of stars
at the AGB luminosity tip, as inferred from eq. (8), for the
elliptical galaxy sample of Table 2. The Mc distribution is summarized
in the lower histogram, and is the maximum actual mass allowed to luminous
stars in the galaxies. One sees that mass of dying stars tends to decrease
with increasing UV-upturn strength, being in general ≤ 0.57 Msun
among giant ellipticals. The "outlier" objects of Fig. 6 are
identified again here, with galaxies labelled according to their NGC number.
The arrow for NGC 1316 accounts for the claimed strong internal reddening for
this galaxy.
Displayed uncertainties for the derived values of Mc take in the full error
budget-- each component of σ(Mc) being added in quadrature--, including
the contribution of Keff observations, K-band bolometric correction
(σ = ± 0.2 mag), and the Ktip vs. Keff
calibration (σ = ±0.2 mag). See text for a discussion.
|
Back to article listing |
 |
Shortcut to the SSP models |
| AB/Dec 2008 |